Area Chart Presentation Template for PowerPoint, Canva & Google Slides
Download the template for PowerPoint, Google Slides or Canva with just one click
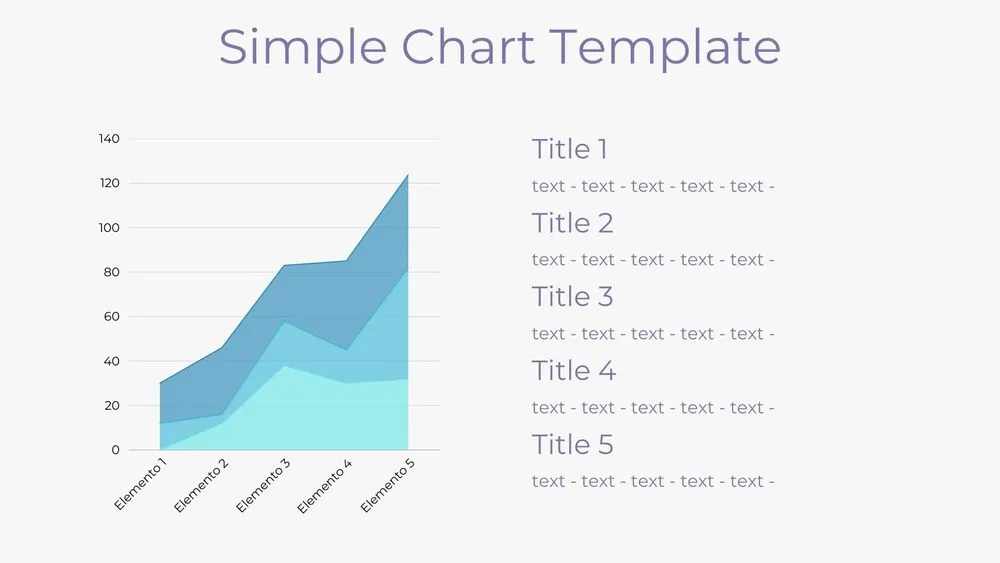
Editable Area Chart Templates and Slides for Performance & Growth
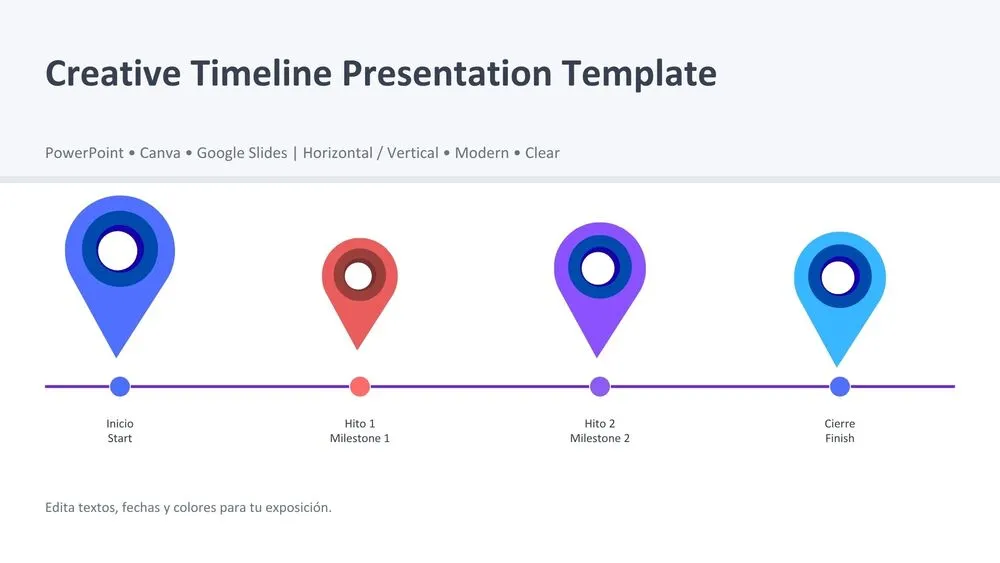
A modern area chart template with layered blue sections that emphasize growth, decline, and trends over time. Each layer is color-coded to help differentiate categories and highlight variations in performance. The clean style makes it a versatile tool for illustrating financial reports, market analysis, or academic projects where the evolution of data needs to be clear. Its minimal design ensures the focus remains on the information while keeping the visuals professional and attractive.
- Clean and modern area chart design
- Progressive layered style
- Editable axis and values
- Highlight growth and performance over time
- Perfect for economics, finance, or academic projects
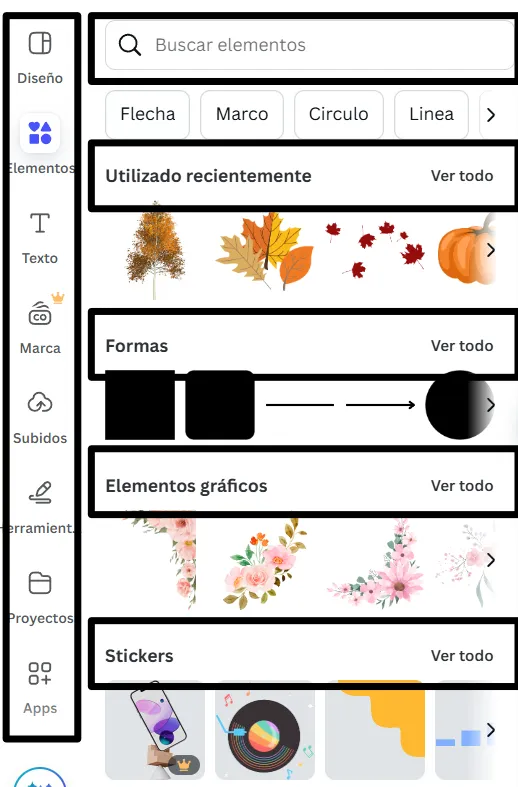
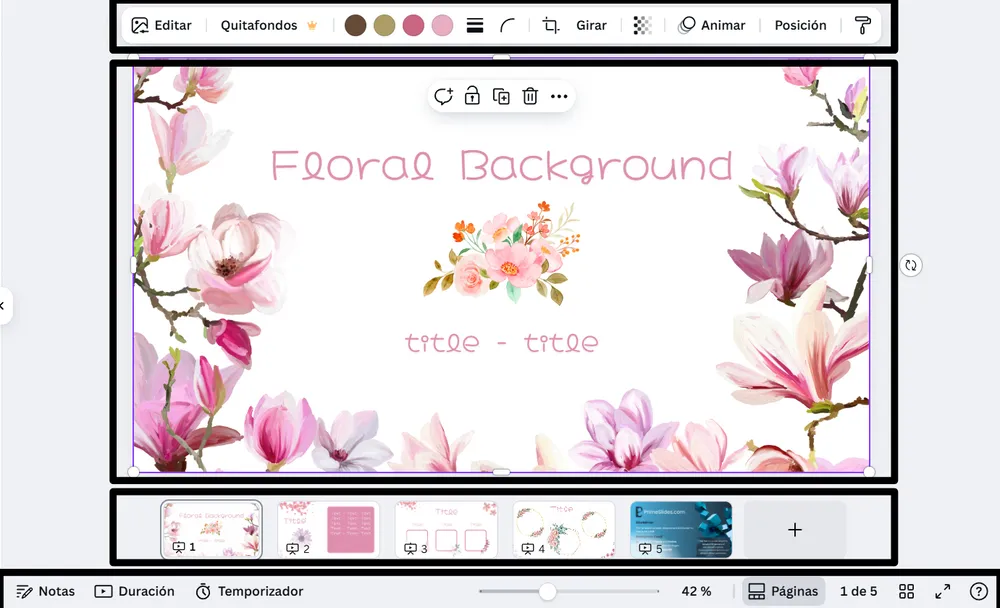
Edit fonts, colors, and images effortlessly using Canva’s drag-and-drop editor. Access free elements, illustrations, and fonts to personalize each slide your way.
📌 Frequently Asked Questions
Click on the Google Slides button, then select “Make a copy” when prompted. This will create a copy of the template in your Google Drive, ready to edit and use in Google Slides.
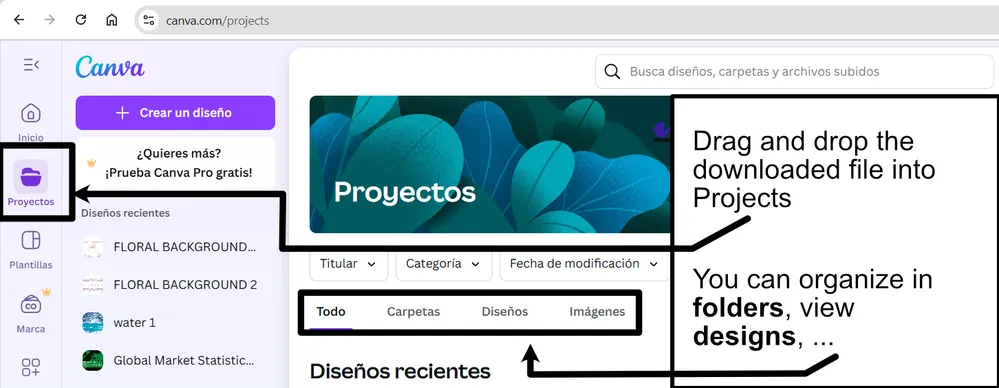
Simply download the file, then open Canva and drag the downloaded file into your desired folder. Once uploaded, it’s ready to be edited just like any other Canva project.