Bar Chart Presentation Template for PowerPoint, Canva & Google Slides
Download the template for PowerPoint, Google Slides or Canva with just one click
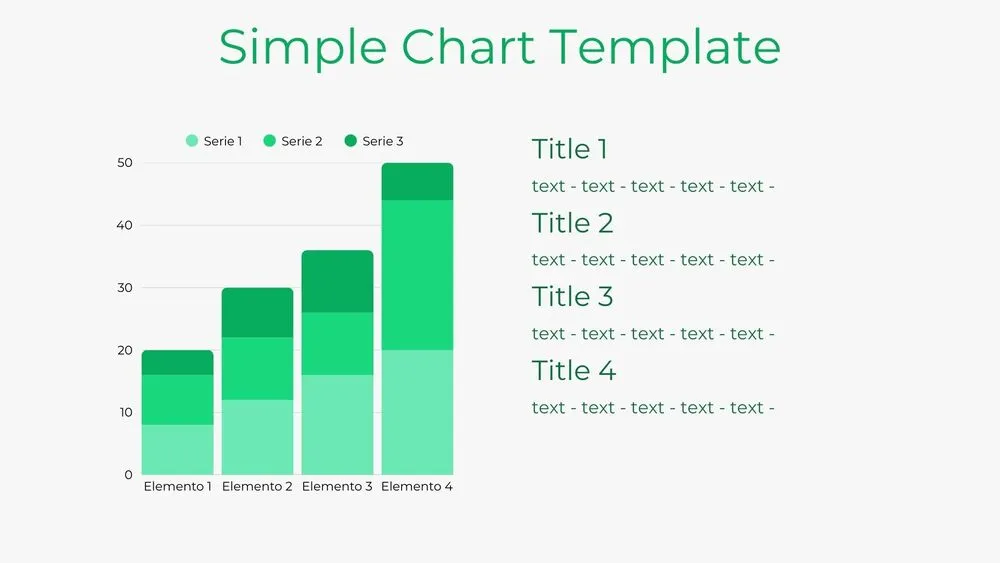
Editable Bar Chart Templates and Slides for Finance & KPI
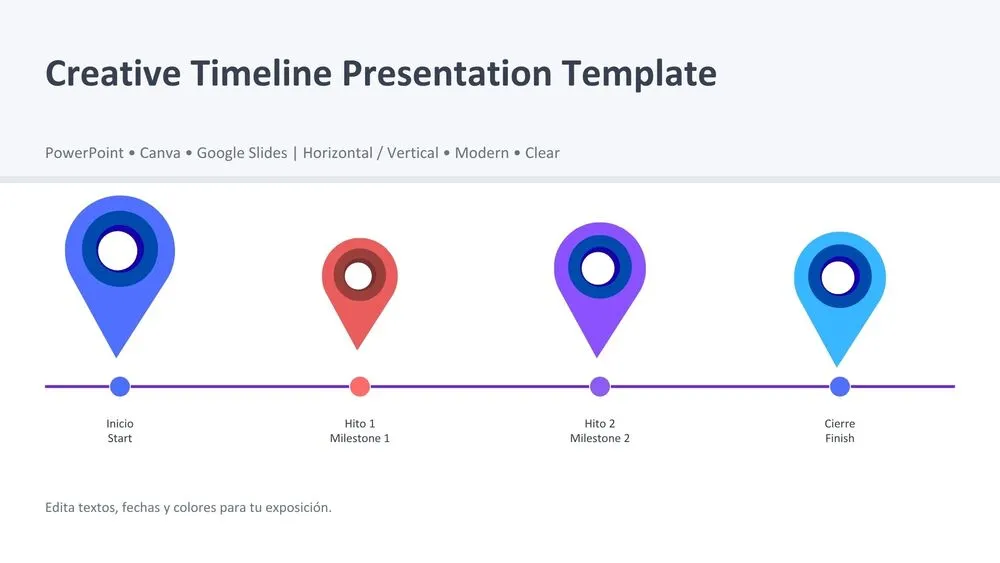
This bar chart template uses clean vertical bars in green tones to emphasize clarity and readability. Featuring four customizable categories, it’s ideal for representing budgets, goals, performance metrics, or financial comparisons. The straightforward structure ensures the data is easy to interpret, while the modern design makes it equally effective in classrooms, corporate meetings, and strategic presentations. A versatile choice for anyone needing a professional yet simple way to compare information.
- Clean vertical bar chart design
- 4 customizable elements
- Green and white minimalist theme
- Perfect for finance and KPI reporting
- Editable axis, titles, and labels
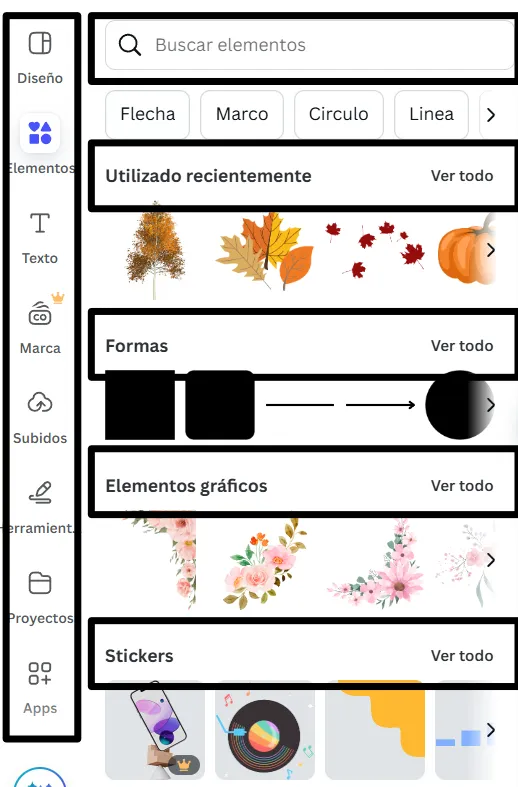
Edit fonts, colors, and images effortlessly using Canva’s drag-and-drop editor. Access free elements, illustrations, and fonts to personalize each slide your way.
📌 Frequently Asked Questions
Click on the Google Slides button, then select “Make a copy” when prompted. This will create a copy of the template in your Google Drive, ready to edit and use in Google Slides.
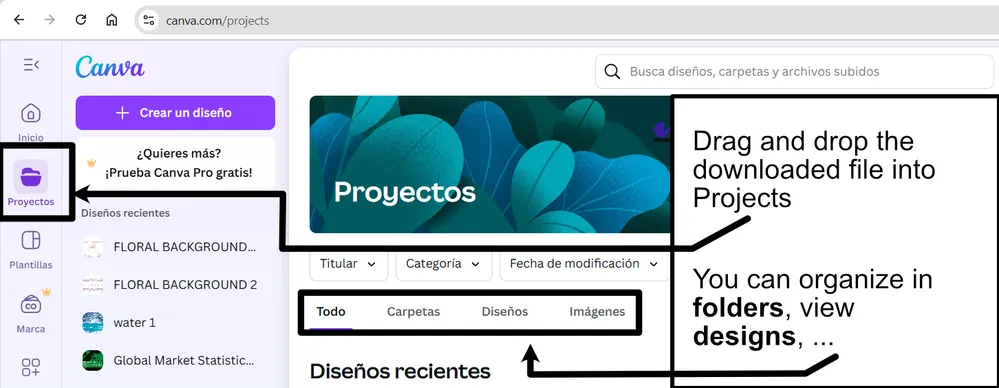
Simply download the file, then open Canva and drag the downloaded file into your desired folder. Once uploaded, it’s ready to be edited just like any other Canva project.