Global Market Statistics Overview Presentation Template for PowerPoint, Canva & Google Slides
Download the template for PowerPoint, Google Slides or Canva with just one click
Market Analytics Presentation Template and Slides for KPI Reporting
Deliver crisp insights on a dark canvas with neon-green accents for high contrast. The cover highlights a world map and a bold title block. The second slide pairs a pie chart on the right with a left-hand table for labeling segments and notes; the third mirrors the pie with text-only commentary. A fourth slide introduces finance and operations icons—volatility arrow, hands with check mark, calculator, documents, dollar symbol, upward bar chart and a bank-like building—to support narrative points. Built for market research, performance tracking and investment reviews.
- 🌍 High-contrast black background with luminous green UI accents
- 🥧 Pie chart + table combo for segment breakdowns
- 🧾 Commentary slide for executive summaries and proposals
- 💹 KPI icon set for finance, risk, documents and growth
- 🗺️ Global map graphic to frame regions and categories
- 🧭 Ideal for market analysis, research and strategic planning
- 🧱 Clean grid, legible typography and annotation-friendly space
- 🖥️ Works in PowerPoint, Canva and Google Slides (single presentation template)
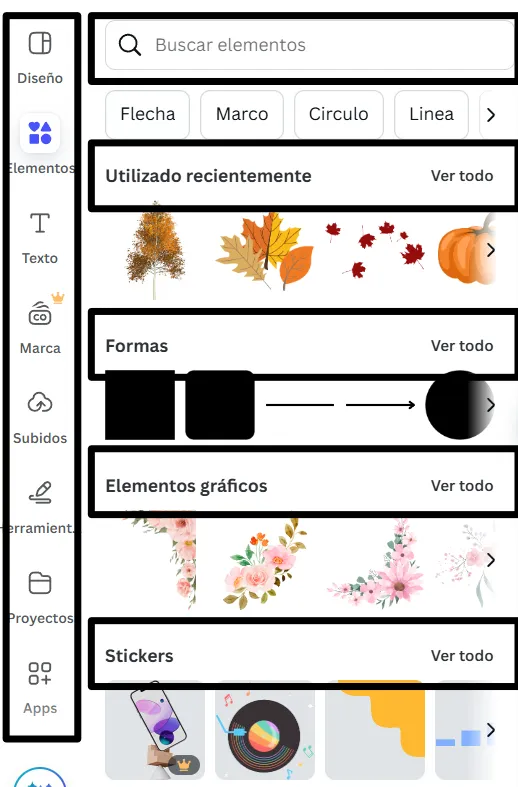
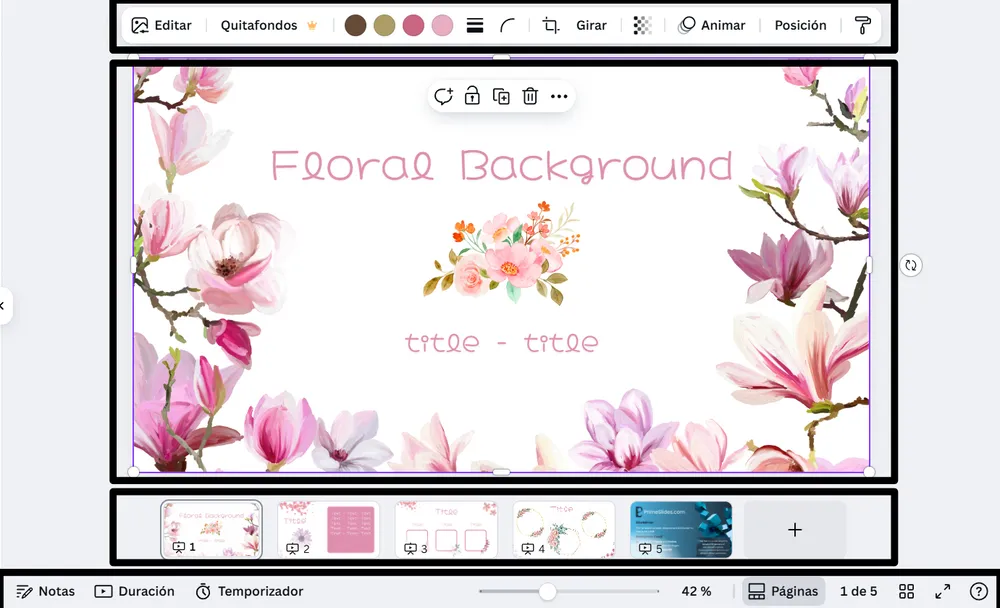
Edit fonts, colors, and images effortlessly using Canva’s drag-and-drop editor. Access free elements, illustrations, and fonts to personalize each slide your way.
📌 Frequently Asked Questions
Click on the Google Slides button, then select “Make a copy” when prompted. This will create a copy of the template in your Google Drive, ready to edit and use in Google Slides.
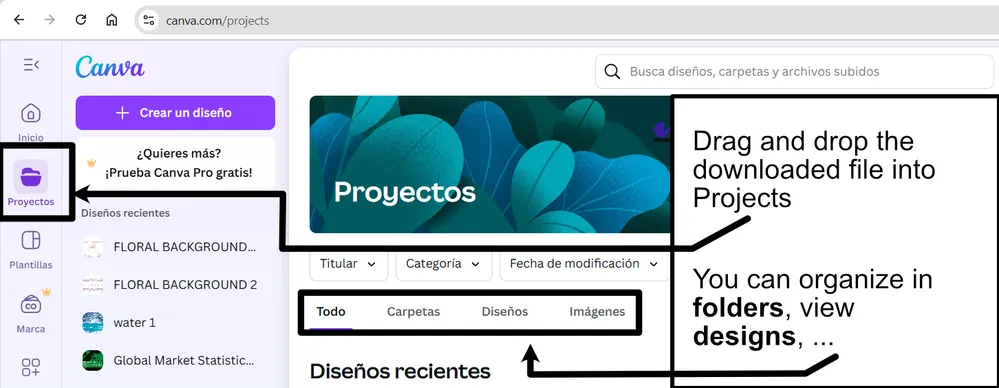
Simply download the file, then open Canva and drag the downloaded file into your desired folder. Once uploaded, it’s ready to be edited just like any other Canva project.


