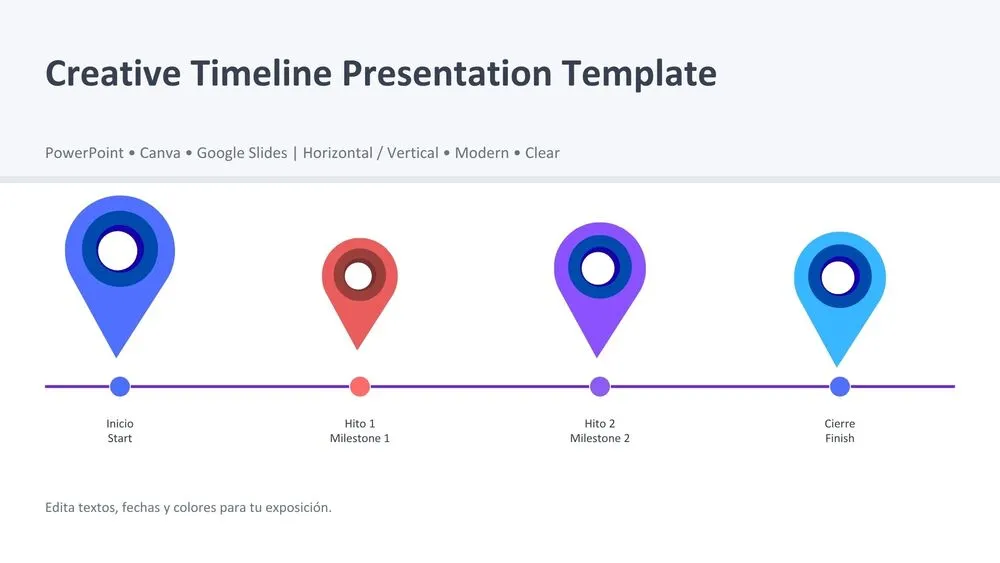
Minimalist Blue Fishbone Diagram Presentation Template for PowerPoint, Canva & Google Slides
Download the template for PowerPoint, Google Slides or Canva with just one click
Fishbone Diagram Presentation Template and Slides for Root-Cause Analysis
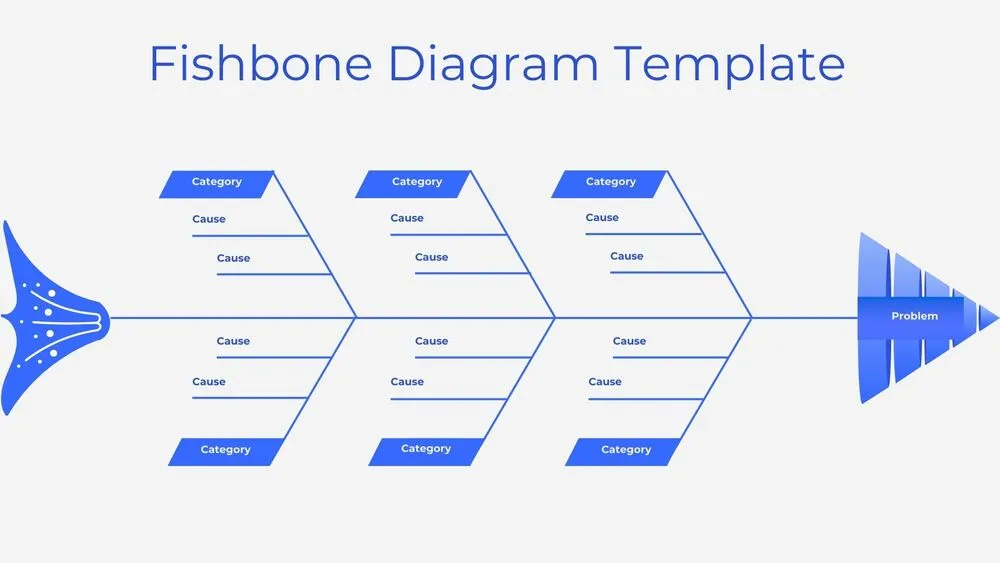
Diagnose problems visually with a clean, horizontal fishbone diagram in solid blue. The spine leads to a right-pointing head (triangle) labeled Problem, while angled ribs organize Category labels and cause notes above and below the line. This structure helps teams separate symptoms from drivers and uncover relationships among people, process, tools, and environment. Use it for strategic planning, quality improvement, project retrospectives and classroom exercises in economics or business. The flat, minimalist styling keeps attention on thinking, not decoration.
- 🐟 Classic fishbone layout for fast root-cause mapping
- 🔷 Solid blue, flat design for maximum readability
- 🏷️ Category ribs with editable cause callouts (up & down branches)
- 🧭 Ideal for strategy, project management, checklists and decision reviews
- 🧑🏫 Teacher-friendly for university and training sessions
- ✍️ Clear text fields for goals, KPIs and action items
- 📐 Widescreen 16:9 with tidy spacing and alignment
- 🖥️ Works in PowerPoint, Canva and Google Slides (single presentation template)
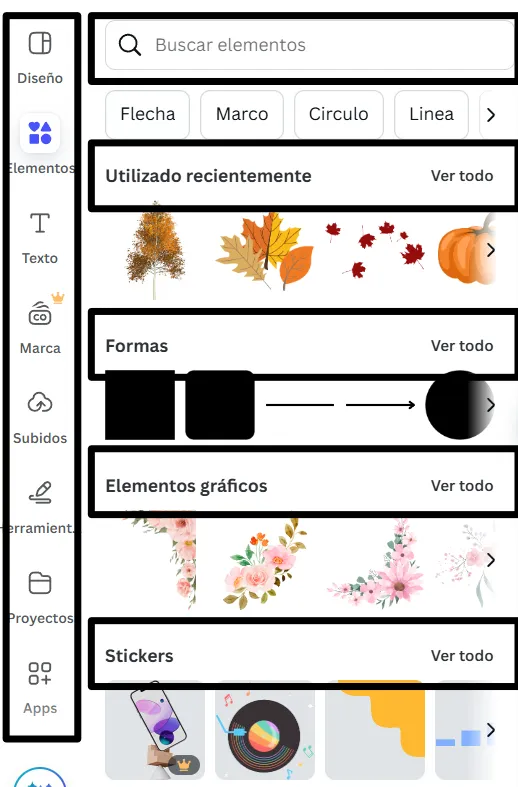
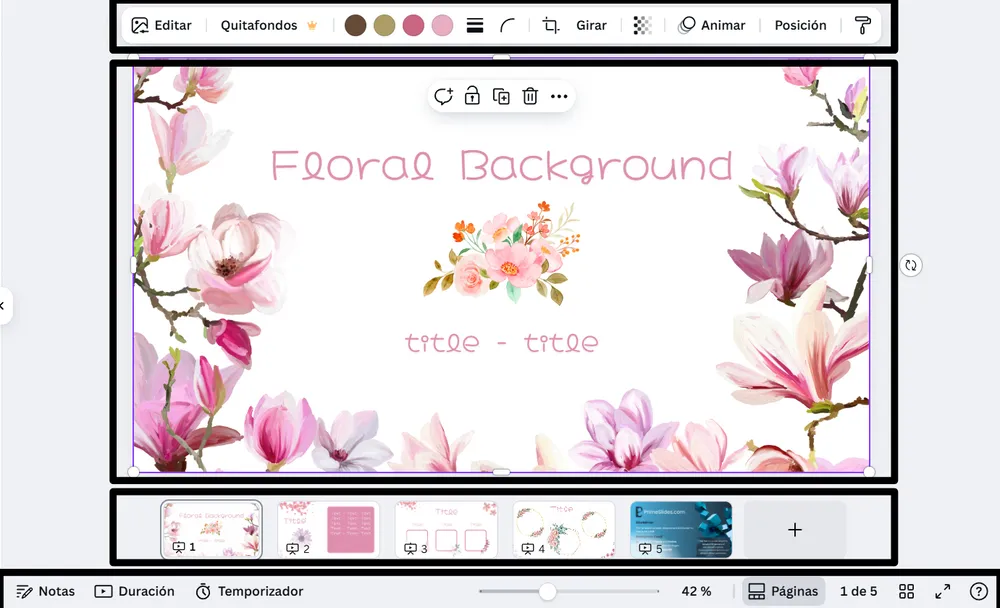
Edit fonts, colors, and images effortlessly using Canva’s drag-and-drop editor. Access free elements, illustrations, and fonts to personalize each slide your way.
📌 Frequently Asked Questions
Click on the Google Slides button, then select “Make a copy” when prompted. This will create a copy of the template in your Google Drive, ready to edit and use in Google Slides.
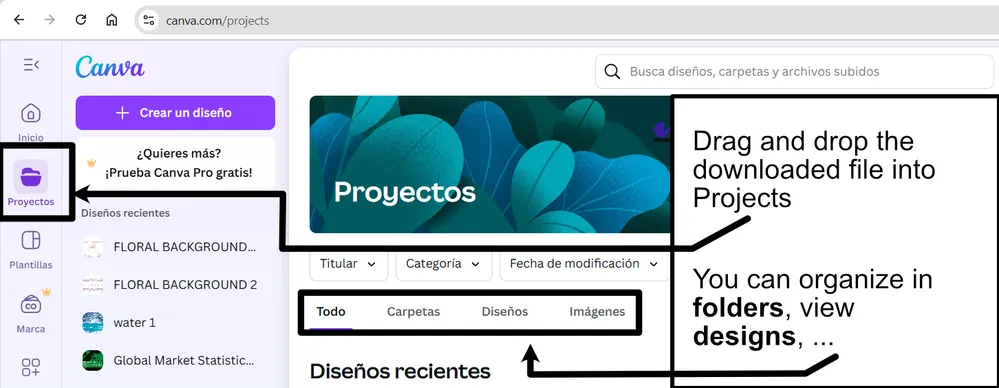
Simply download the file, then open Canva and drag the downloaded file into your desired folder. Once uploaded, it’s ready to be edited just like any other Canva project.