Line Chart Presentation Template for PowerPoint, Canva & Google Slides
Download the template for PowerPoint, Google Slides or Canva with just one click
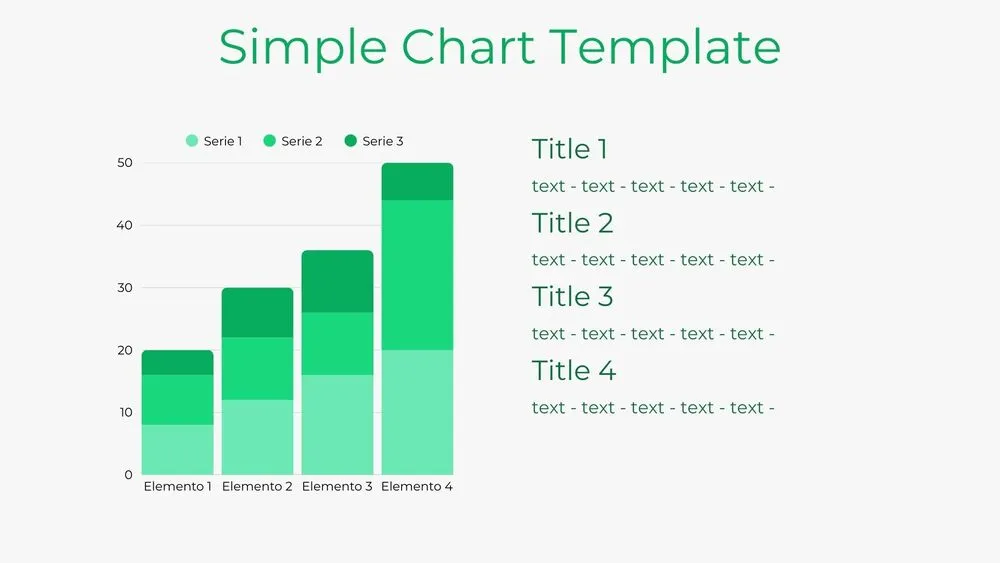
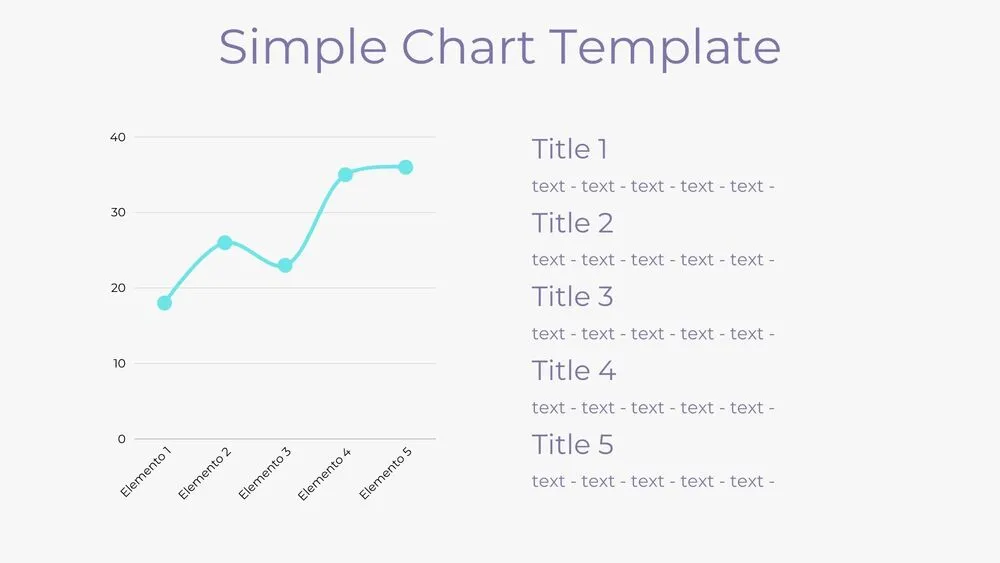
Editable Line Chart Templates and Slides for KPI & Market Analysis
This line chart template is designed to display data progression with precision and clarity. Each point is marked and connected with smooth lines, making it easy to track comparisons across multiple variables. With its minimalist blue theme, it works perfectly for performance tracking, academic analysis, KPI monitoring, or market trend presentations. Its clean aesthetic ensures data is communicated effectively, helping audiences grasp insights quickly in both educational and business contexts.
- Clean point-based line chart
- Editable Y/X axis and labels
- Multiple line variations
- Great for KPI tracking and market trends
- Simple blue design for clarity
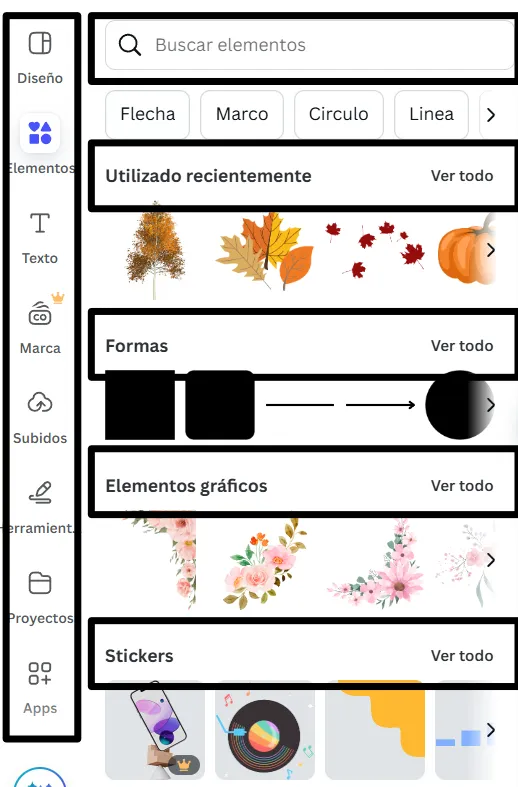
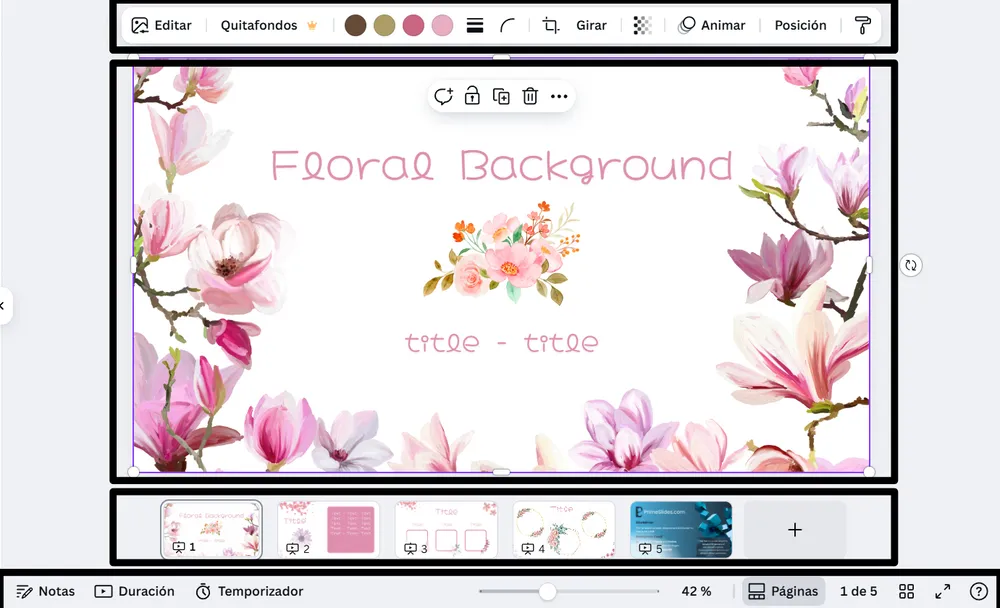
Edit fonts, colors, and images effortlessly using Canva’s drag-and-drop editor. Access free elements, illustrations, and fonts to personalize each slide your way.
📌 Frequently Asked Questions
Click on the Google Slides button, then select “Make a copy” when prompted. This will create a copy of the template in your Google Drive, ready to edit and use in Google Slides.
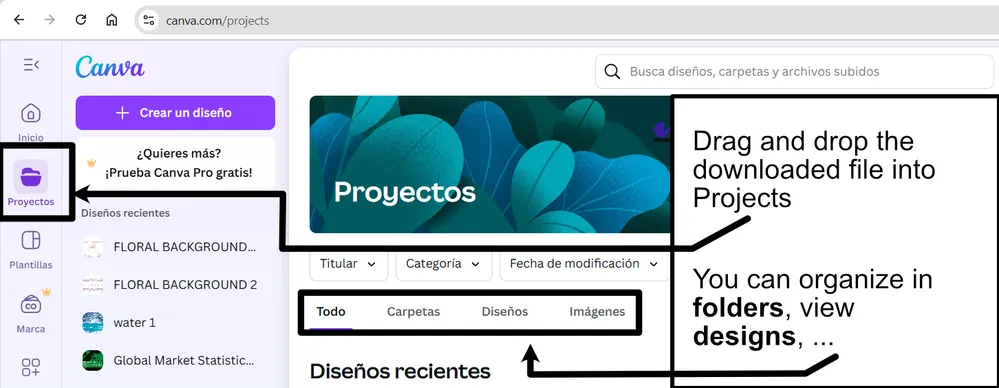
Simply download the file, then open Canva and drag the downloaded file into your desired folder. Once uploaded, it’s ready to be edited just like any other Canva project.