Solid Pie Chart Presentation Template for PowerPoint, Canva & Google Slides
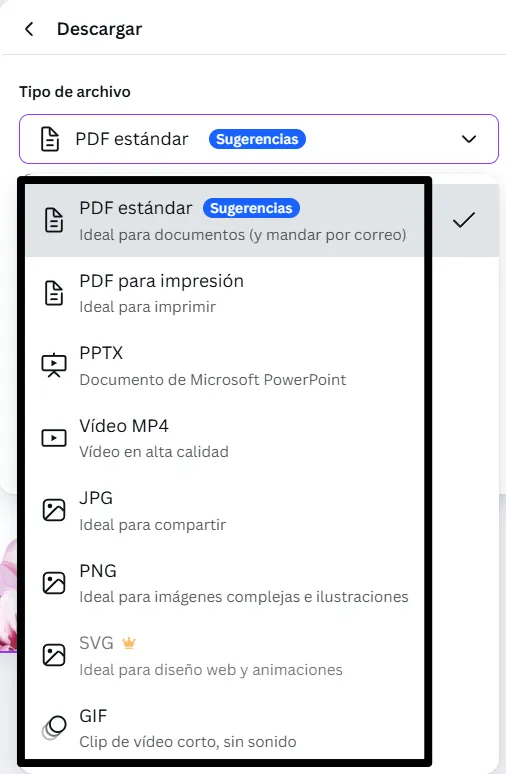
Download the template for PowerPoint, Google Slides or Canva with just one click
Editable Pie Chart Templates and Slides for Reports & Dashboards
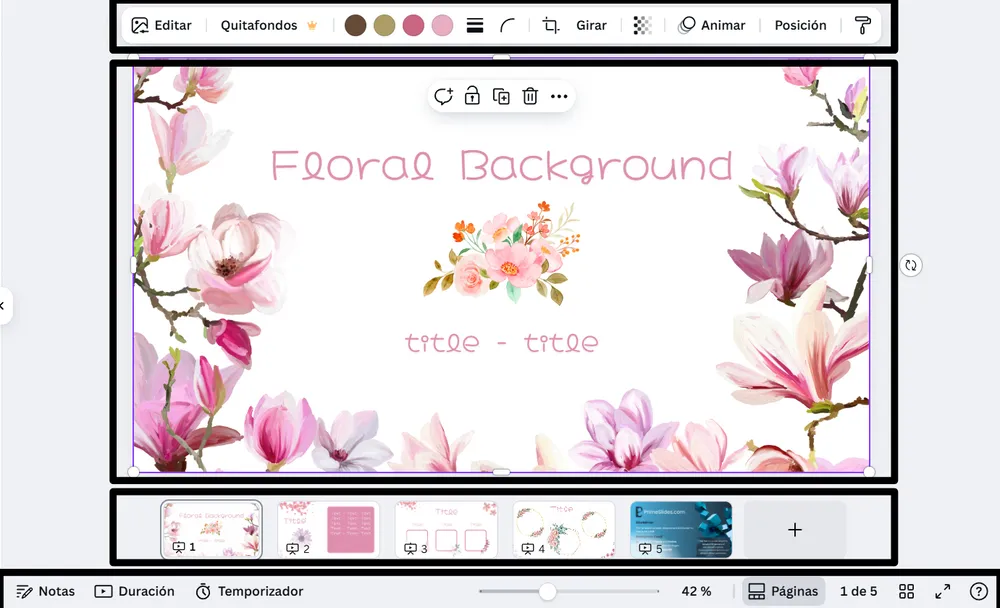
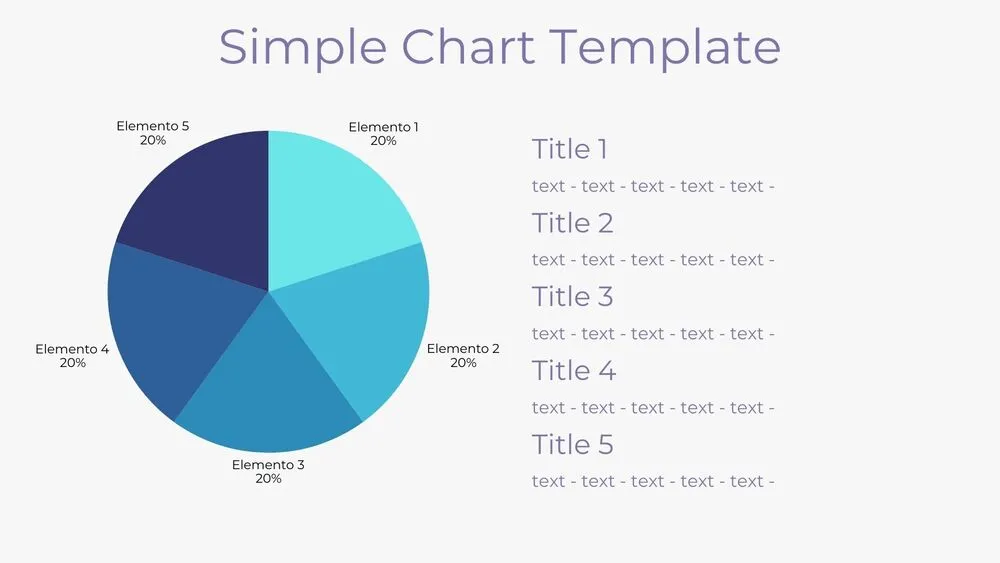
A classic solid pie chart template where all segments are joined together in a unified circular shape. Divided into five editable sections, each slice has dedicated space for a title and description. The blue and white design keeps it simple yet professional, making it suitable for executive summaries, market research, financial reports, or academic projects. Its straightforward layout makes percentages and proportions easy to present with clarity and confidence.
- Classic solid pie chart design
- 5 customizable segments
- Simple blue and white theme
- Editable titles and captions
- Great for dashboards, proposals, and executive summaries
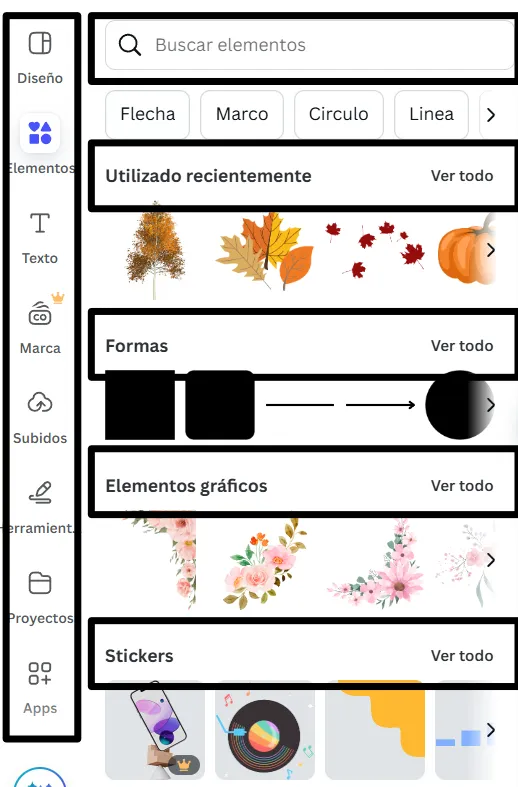
Edit fonts, colors, and images effortlessly using Canva’s drag-and-drop editor. Access free elements, illustrations, and fonts to personalize each slide your way.
📌 Frequently Asked Questions
Click on the Google Slides button, then select “Make a copy” when prompted. This will create a copy of the template in your Google Drive, ready to edit and use in Google Slides.
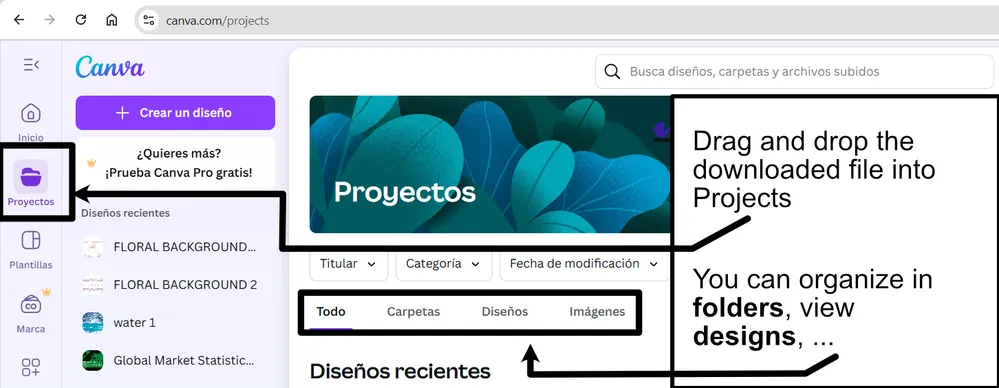
Simply download the file, then open Canva and drag the downloaded file into your desired folder. Once uploaded, it’s ready to be edited just like any other Canva project.