Chart Presentation Templates and Slides – Free & Premium for PowerPoint, Canva & Google Slides
Download free chart presentation templates for PowerPoint, Canva, and Google Slides. Turn timelines, org charts, and process visuals into clear decisions ⬇️
Explore the Best Chart PowerPoint Templates, Google Slides & Canva Chart Themes
✨ Chart slides help you explain complex information at a glance, without turning your deck into a spreadsheet. Use these layouts for timelines, org structures, process flows, comparisons, and KPI visuals that people can scan quickly.
They’re ideal for project updates, strategy decks, reporting, and workshops. Pick flowcharts for decisions, funnels for pipeline stages, timelines for planning, and simple line or pie charts for trends and category mix.
Edit in PowerPoint, Canva, or Google Slides, then present live or export a clean PDF for sharing. Update labels, legends, and series colors in seconds, and keep meaning consistent by using the same color rules across the whole deck.
Best for:
- Project timelines and planning views
- Process maps and decision flows
- Pipeline and funnel reporting
- KPI trends and performance updates
- Comparisons and overlap diagrams
Explore related templates:
Readability tip: Label charts directly on the visual when possible, and avoid using more than three highlight colors on one slide.
❓ FAQs
Are these Chart presentation templates free to download?
Yes—this tag includes free chart presentation templates. If a template is premium, it will be clearly labeled on its template page.
How do I create a Gantt chart in Google Slides or PowerPoint?
Start with a timeline or Gantt-style slide and edit the task bars, dates, and owners. If you’re using linked data, refresh right before you present.
What’s the fastest way to build an org chart?
Use an org chart layout, replace names and titles, then duplicate nodes to add levels. Keep spacing and line thickness consistent for a clean hierarchy.
Flowchart vs funnel vs pyramid, when should I use each?
Use a flowchart for steps and decisions, a funnel for staged drop-off, and a pyramid for ranked layers or priorities. Choose the shape that matches your story.
Do these slides work in PowerPoint, Canva, and Google Slides?
Yes, you can edit these chart layouts in PowerPoint, Canva, and Google Slides, then export to PDF for sharing.
Can I link data from spreadsheets?
Yes. PowerPoint supports linked objects, and Google Slides can link ranges from Google Sheets. Refresh links and keep colors consistent before presenting.
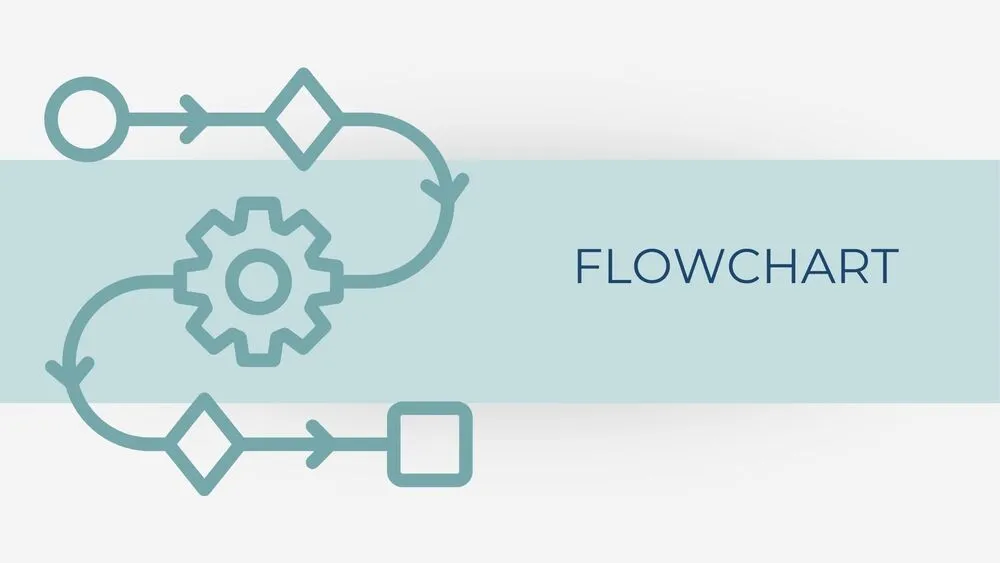
Minimalist Blue Flowchart Diagram Presentation Template for PowerPoint, Canva & Google Slides
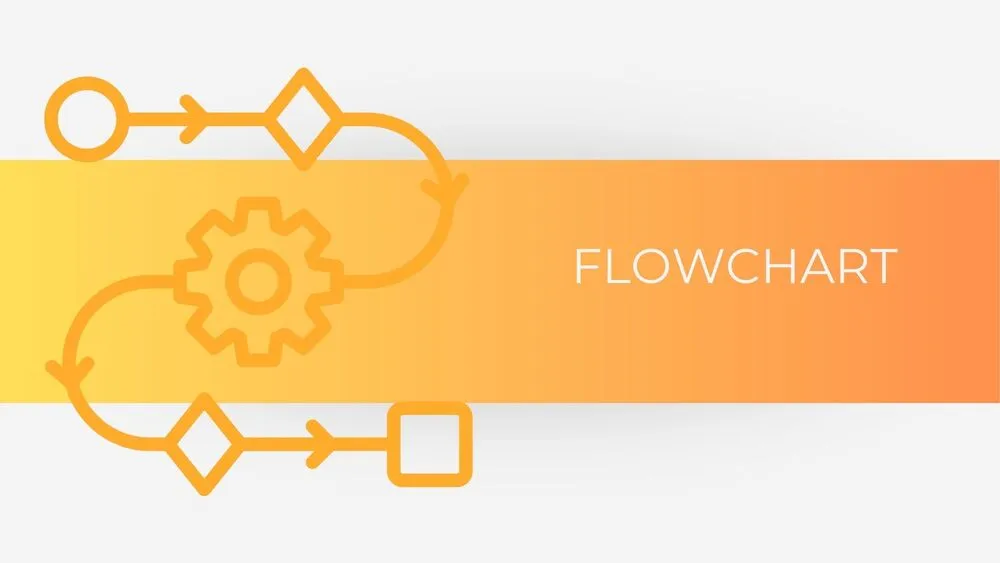
Minimalist Orange Flowchart Diagram Presentation Template for PowerPoint, Canva & Google Slides
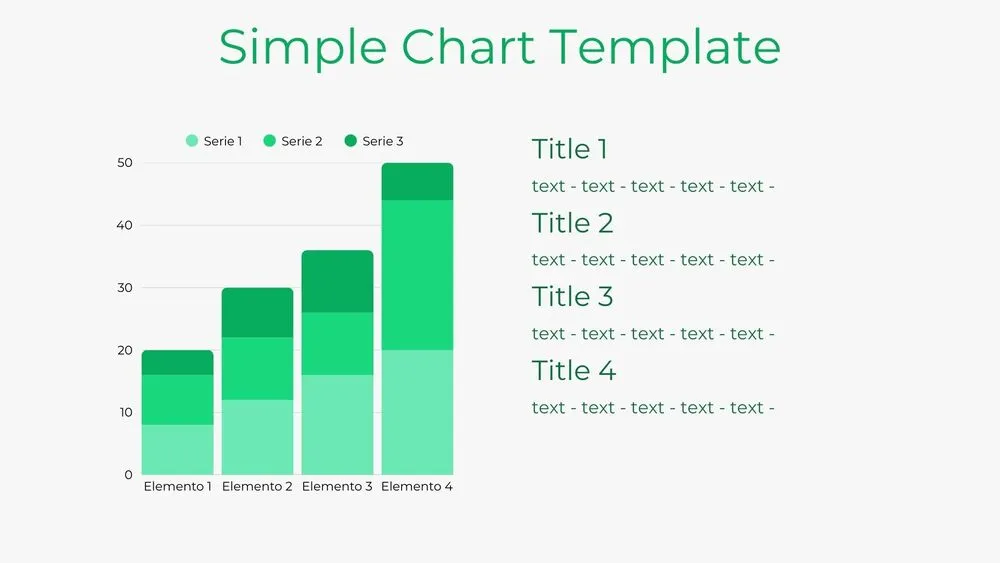
Bar Chart Presentation Template for PowerPoint, Canva & Google Slides
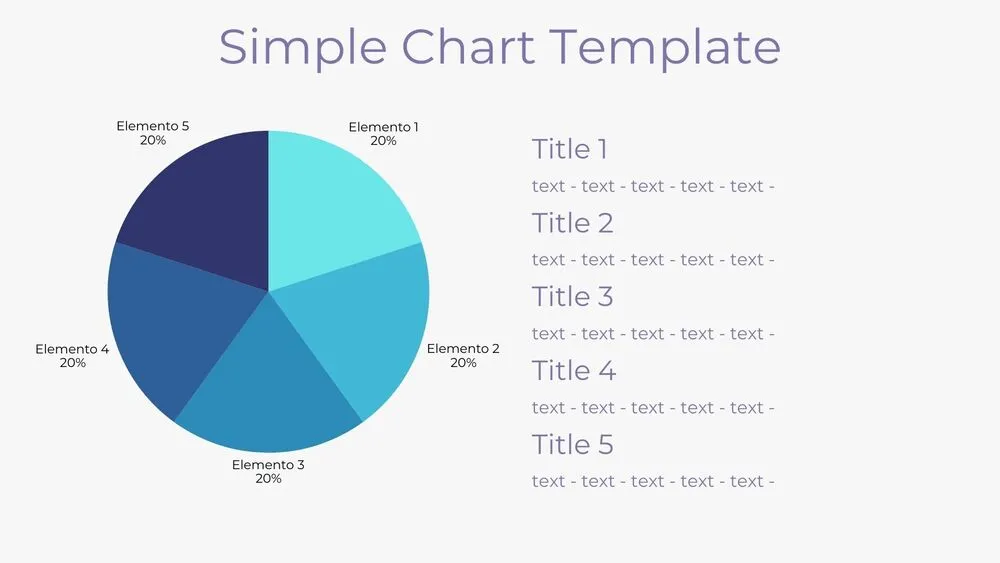
Solid Pie Chart Presentation Template for PowerPoint, Canva & Google Slides
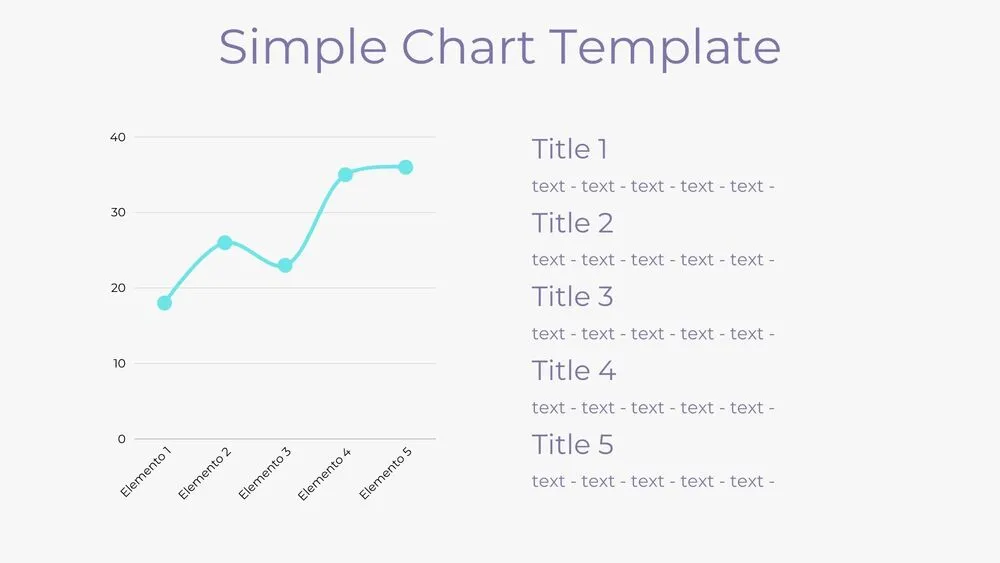
Line Chart Presentation Template for PowerPoint, Canva & Google Slides
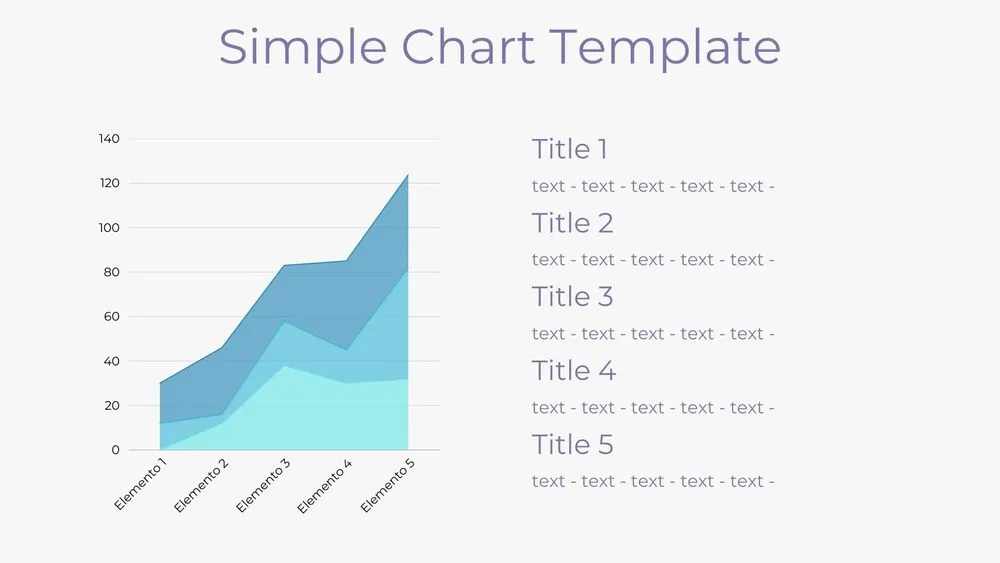
Area Chart Presentation Template for PowerPoint, Canva & Google Slides
Donut Pie Chart Presentation Template for PowerPoint, Canva & Google Slides

Tech Startup Competitive Analysis Presentation Template for PowerPoint, Canva & Google Slides