Economics Presentation Templates and Slides – Free & Premium for PowerPoint, Canva & Google Slides
Download free economics presentation templates for PowerPoint, Canva, and Google Slides. Explain GDP, inflation, unemployment, supply and demand, and policy effects clearly ⬇️
Explore the Best Economics PowerPoint Templates, Google Slides & Canva Economics Themes
✨ Economics slide decks help you turn abstract models and data into visuals people can understand quickly. Use these layouts for macro topics like GDP, inflation, and unemployment, plus micro concepts like supply and demand, elasticity, and market structure.
They’re ideal for classrooms, university lectures, and business briefings that need clear charts and simple explanations. Add a few headline indicators, a model diagram, and one real-world case example, then summarize the “so what” in a short takeaway slide.
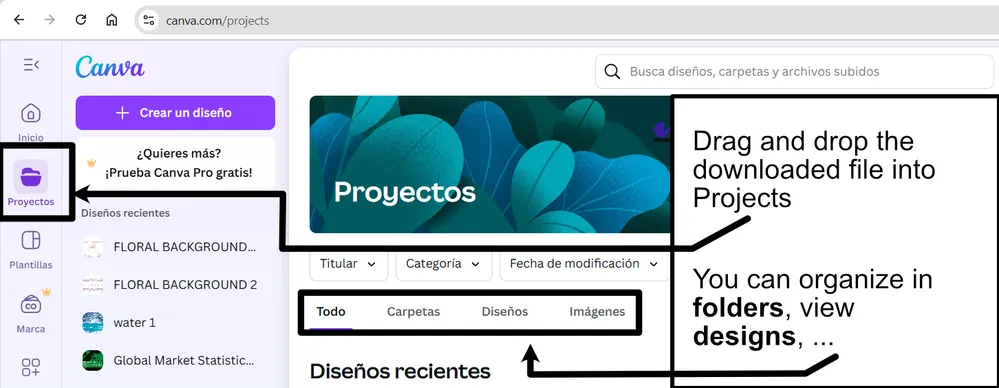
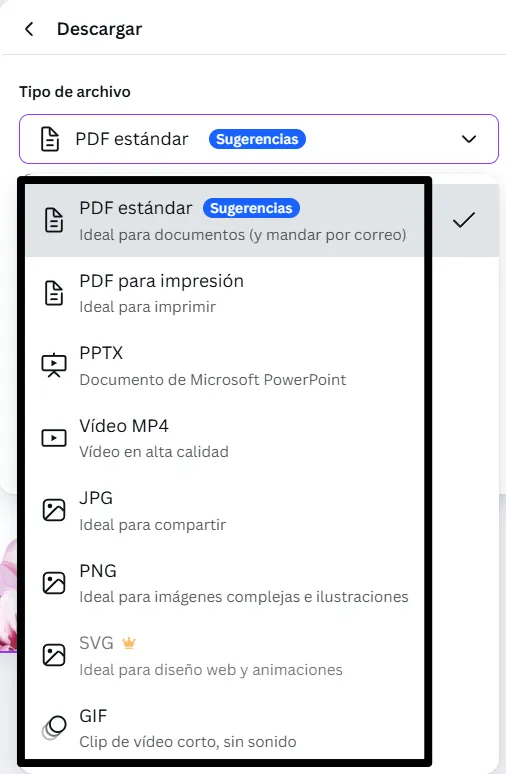
Edit in PowerPoint, Canva, or Google Slides, then present live or export a clean PDF for sharing. Paste or link data from spreadsheets, keep units and sources consistent, and use the same chart style across the deck for readability.
Best for:
- Macroeconomics dashboards and country snapshots
- Supply and demand lessons and model diagrams
- Inflation, unemployment, and policy discussions
- Data-driven class presentations and exams review
- Business briefings on markets and trends
Explore related templates:
Readability tip: Use one clear chart per slide, label axes and units, and add a short annotation that explains what changed and why it matters.
❓ FAQs
Are these Economics presentation templates free to download?
Yes—this tag includes free economics presentation templates. If a template is premium, it will be clearly labeled on its template page.
What is an economics presentation template?
A subject-focused deck with charts, diagrams, and tables to explain macro and micro topics like growth, inflation, labor, markets, and policy trade-offs.
Which slides should I include?
Objectives, key terms, a data overview, model diagrams, one or two case examples, and a summary slide with takeaways and sources.
How do I present economic data clearly?
Use simple axes and units, consistent labels, and short annotations. Cite sources on the slide and avoid packing too many charts into one page.
Do these slides work in PowerPoint, Canva, and Google Slides?
Yes, you can edit these economics layouts in PowerPoint, Canva, and Google Slides, then export to PDF for sharing.
Can I link live data from spreadsheets?
Yes, link a Google Sheets range in Slides or paste a linked chart in PowerPoint. Refresh links before presenting to keep numbers current.
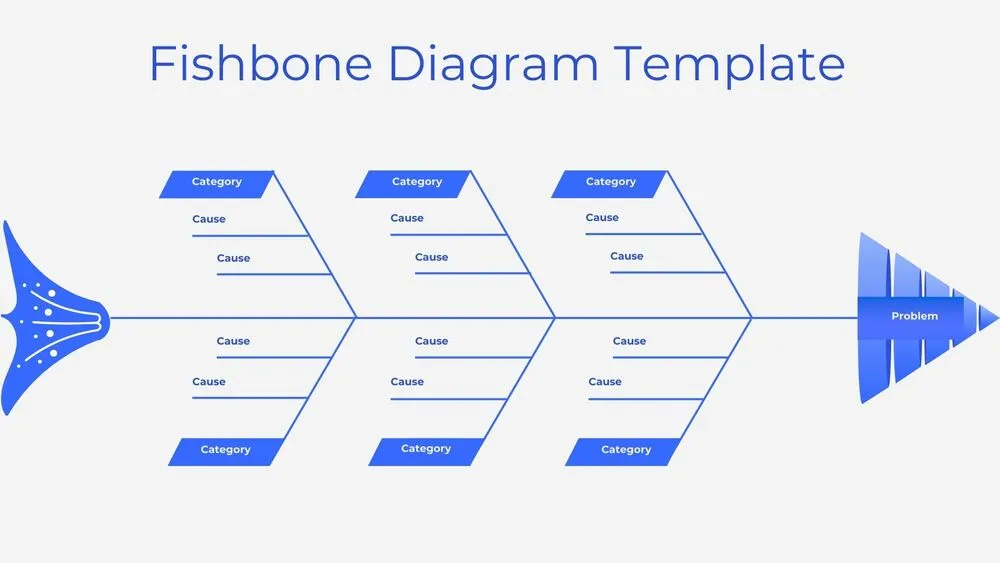
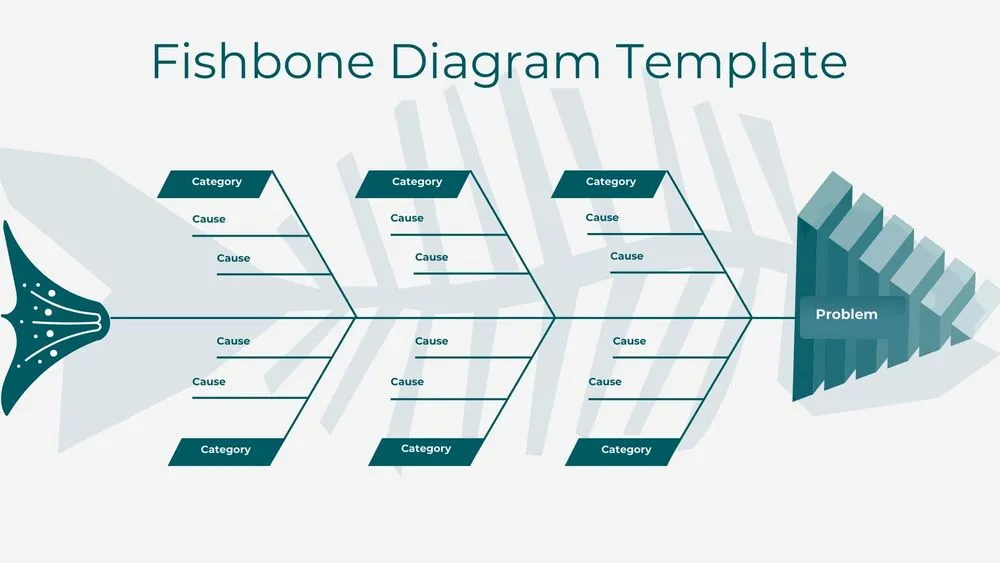
Minimalist Blue Fishbone Diagram Presentation Template for PowerPoint, Canva & Google Slides

Futuristic Gems Timeline Diagram Presentation Template for PowerPoint, Canva & Google Slides

Vertical Wave Timeline Diagram Presentation Template for PowerPoint, Canva & Google Slides
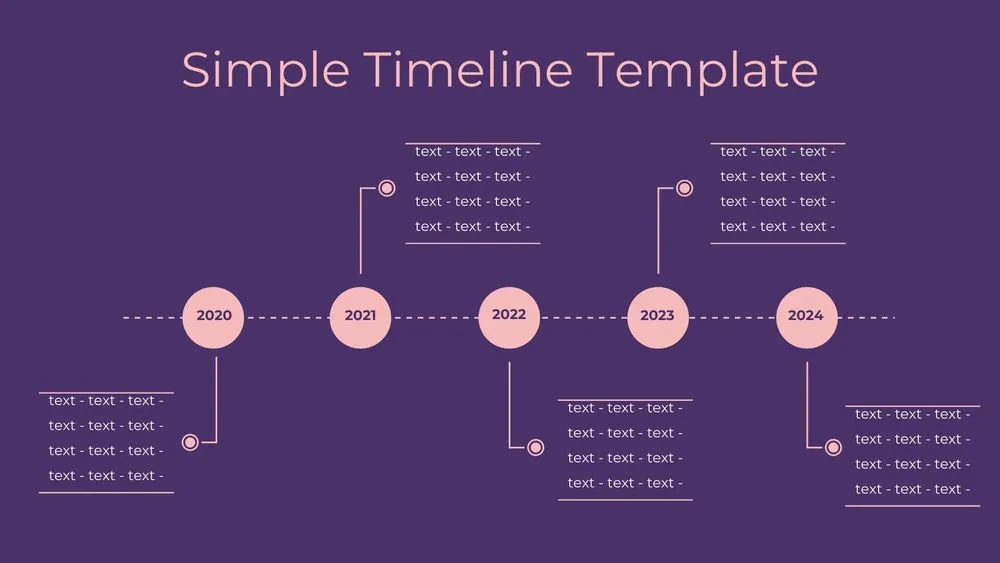
Dark Violet Pins Timeline Diagram Presentation Template for PowerPoint, Canva & Google Slides
Stepped Path Timeline Diagram Presentation Template for PowerPoint, Canva & Google Slides

Atom Path Timeline Diagram Presentation Template for PowerPoint, Canva & Google Slides
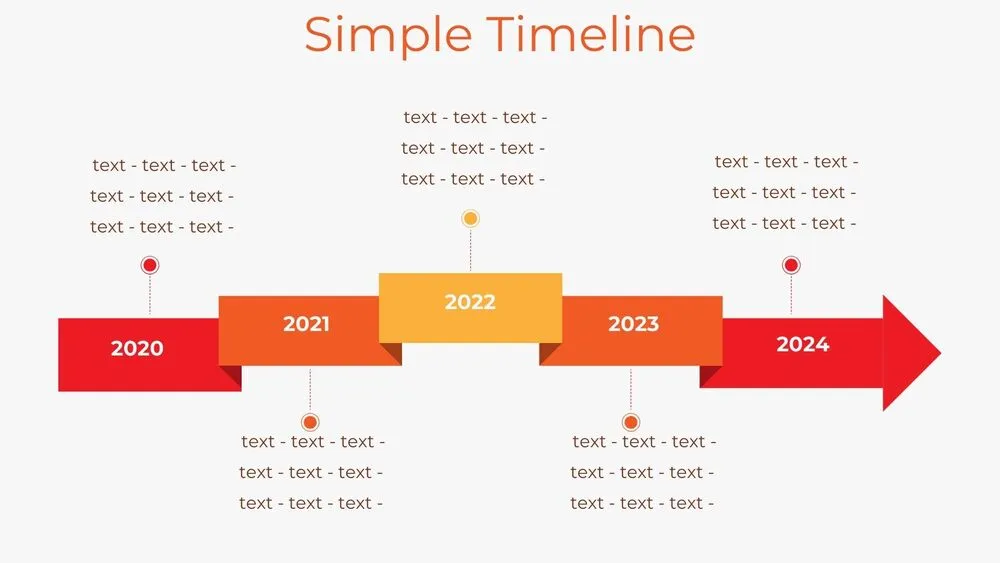
Simple Arrow Timeline Diagram Presentation Template for PowerPoint, Canva & Google Slides

Wavy Road Four-Step Roadmap Diagram Presentation Template for PowerPoint, Canva & Google Slides