Executive Summary Presentation Templates and Slides – Free & Premium for PowerPoint, Canva & Google Slides
Download free executive summary presentation templates for PowerPoint, Canva, and Google Slides. Share insights, KPIs, risks, and next steps in a one-page format leaders can scan fast ⬇️
Explore the Best Executive Summary PowerPoint Templates, Google Slides & Canva Executive Summary Themes
✨ Executive summary slides are made for one-page clarity, so stakeholders understand the story in seconds. Use these layouts to highlight the headline insight, key metrics, risks, and the decisions you need.
Best use cases include board packs, quarterly updates, investor or client recaps, and project status reports. For example, show KPIs vs target, a short risk/mitigation row, and a next-steps strip with owners and dates.
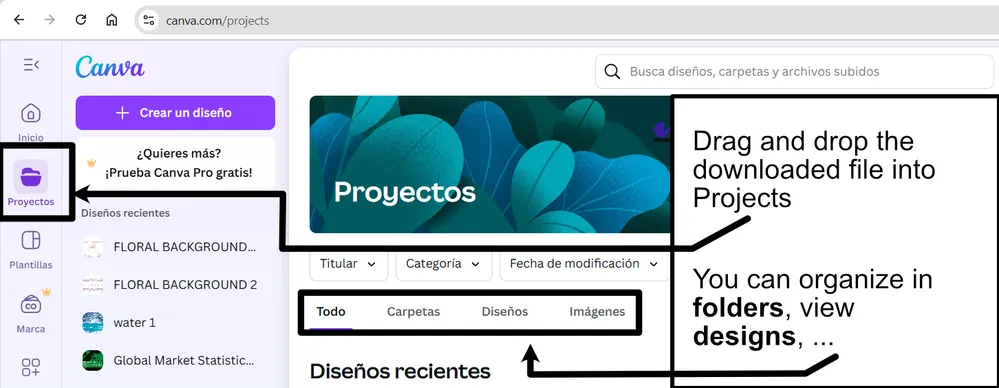
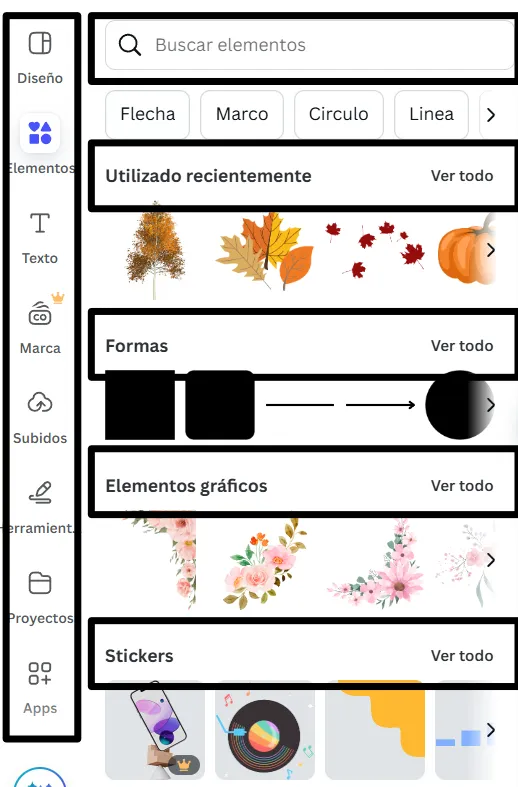
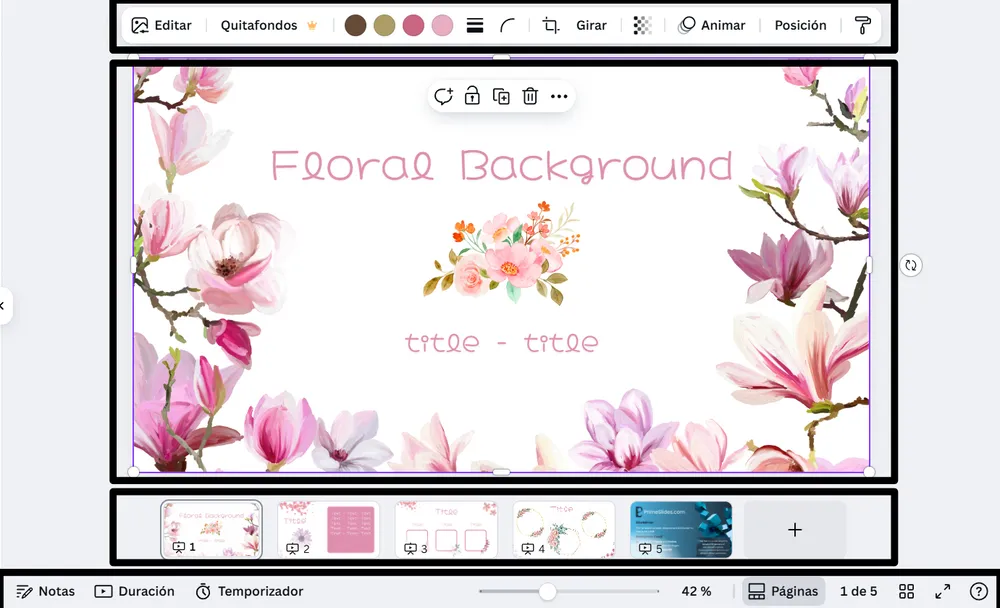
Edit everything in PowerPoint, Canva, or Google Slides, then present live and export a clean PDF for emails, board packets, or meeting follow-ups.
Readability tip: stick to a clear grid, keep numbers large, and replace dense tables with 3–5 KPI tiles and a single chart.
Best for:
- Board packs and leadership updates
- Quarterly business reviews
- Project status one-pagers
- Investor and client recaps
- Strategy and decision briefings
Explore related templates:
❓ FAQs
Are these executive summary presentation templates free to download?
Yes—this tag includes free executive summary presentation templates. If a template is premium, it will be clearly labeled on its template page.
What is an executive summary slide?
A one-page overview that highlights context, key results, KPIs vs target, risks, and decisions so leaders grasp the story quickly.
What should my executive summary include?
Include a headline insight, top takeaways, KPI tiles, key risks with mitigations, and next steps with owners and due dates.
Do these slides work in PowerPoint, Canva, and Google Slides?
Yes, you can edit and present them in PowerPoint, Canva, and Google Slides, then export to PDF for easy sharing.
How do I keep an executive summary to one page?
Limit it to 3–5 KPIs, one small chart, and one row each for risks and next steps. Link details in an appendix slide.
Any design tips for readability?
Use a simple grid, strong hierarchy, and short headlines. Keep whitespace around numbers and avoid dense paragraphs.
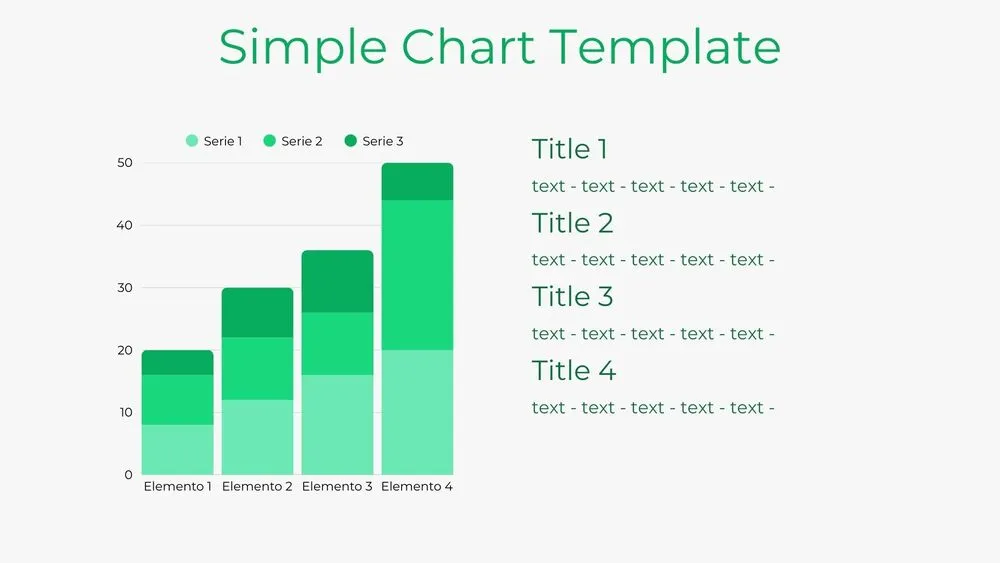
Bar Chart Presentation Template for PowerPoint, Canva & Google Slides
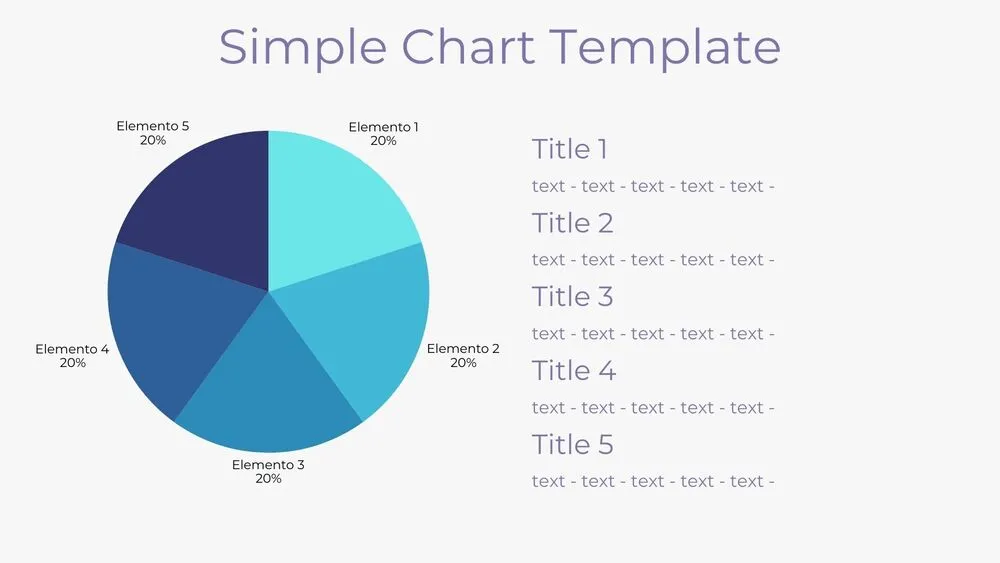
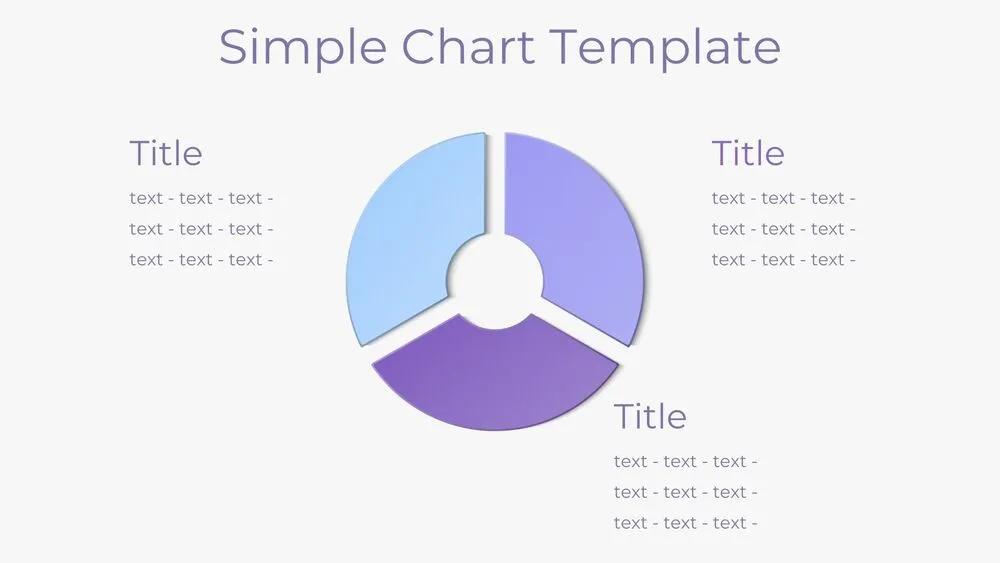
Solid Pie Chart Presentation Template for PowerPoint, Canva & Google Slides
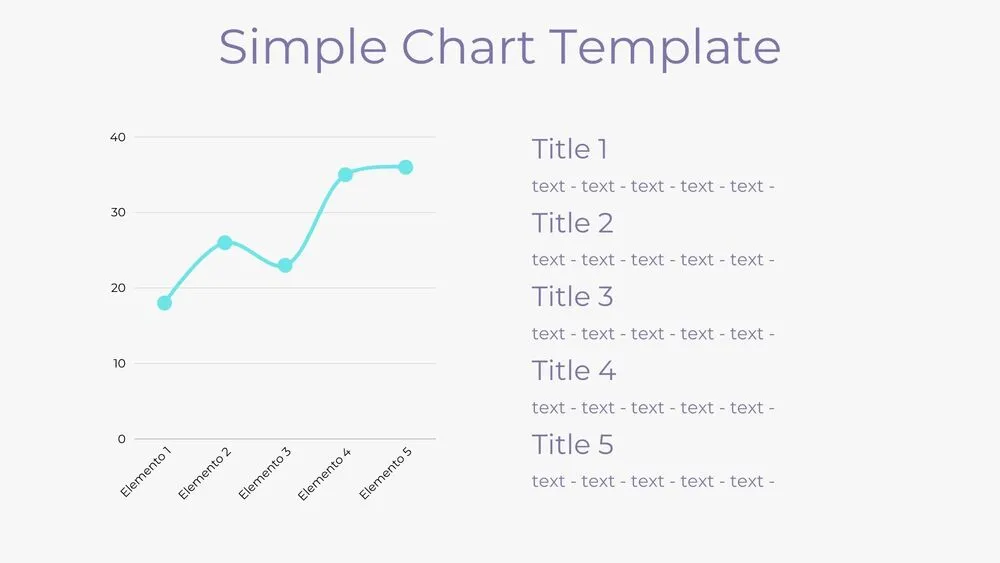
Line Chart Presentation Template for PowerPoint, Canva & Google Slides
Area Chart Presentation Template for PowerPoint, Canva & Google Slides