Finance Presentation Templates and Slides – Free & Premium for PowerPoint, Canva & Google Slides
Download free finance presentation templates for PowerPoint, Canva, and Google Slides. Build budgets, forecasts, and ROI stories with dashboards leaders can scan fast ⬇️
Explore the Best Finance PowerPoint Templates, Google Slides & Canva Finance Themes
✨ Finance slides help you turn numbers into decisions with clean dashboards and structured storytelling. Use these decks to summarize performance, explain drivers, and make budgets and forecasts easy to understand.
Best use cases include board updates, quarterly reviews, budget planning, and investment proposals. For example, show budget vs actual with a variance breakdown, then follow with a cash runway slide and a simple ROI summary.
Edit everything in PowerPoint, Canva, or Google Slides, then present live and export a polished PDF for board packs, investor updates, or internal reporting.
Readability tip: keep scales consistent, label units clearly, and add one takeaway sentence above every chart.
Best for:
- Budgets and forecast decks
- KPI dashboards and performance reviews
- Budget vs actual reporting
- Investment and ROI stories
- Board and leadership updates
Explore related templates:
❓ FAQs
Are these finance presentation templates free to download?
Yes—this tag includes free finance presentation templates. If a template is premium, it will be clearly labeled on its template page.
What is a finance presentation template?
A slide deck built for financial storytelling, with KPI cards, budgets, forecasts, and clear charts that explain performance quickly.
How should I structure a finance presentation?
Start with an executive summary, then KPIs and results, followed by drivers, budget vs actual, cash and runway, risks, and next steps.
Do these slides work in PowerPoint, Canva, and Google Slides?
Yes, you can edit and present them in PowerPoint, Canva, and Google Slides, then export to PDF for sharing.
Which charts work best for finance?
Use line charts for trends, bar charts for comparisons, and waterfalls for variance. Keep labels short and scales consistent.
How can I make finance slides easier to scan?
Use KPI tiles, whitespace, and one takeaway per slide. Avoid dense tables and move detail to an appendix.
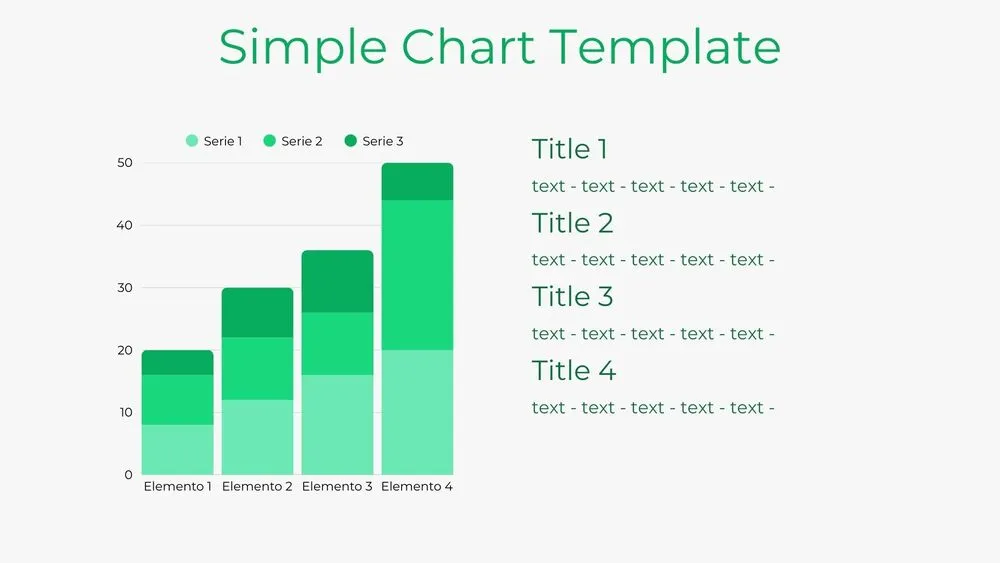
Bar Chart Presentation Template for PowerPoint, Canva & Google Slides
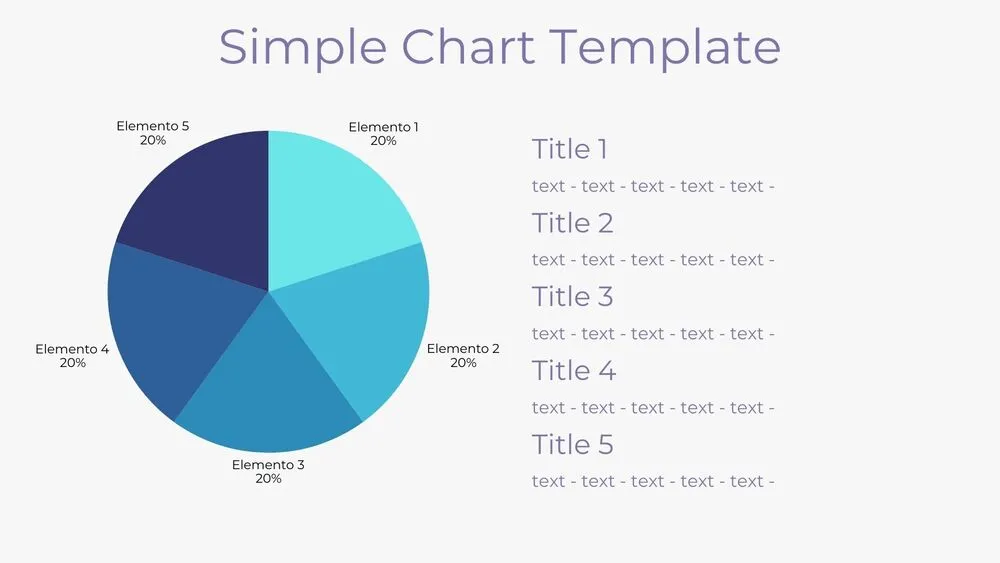
Solid Pie Chart Presentation Template for PowerPoint, Canva & Google Slides
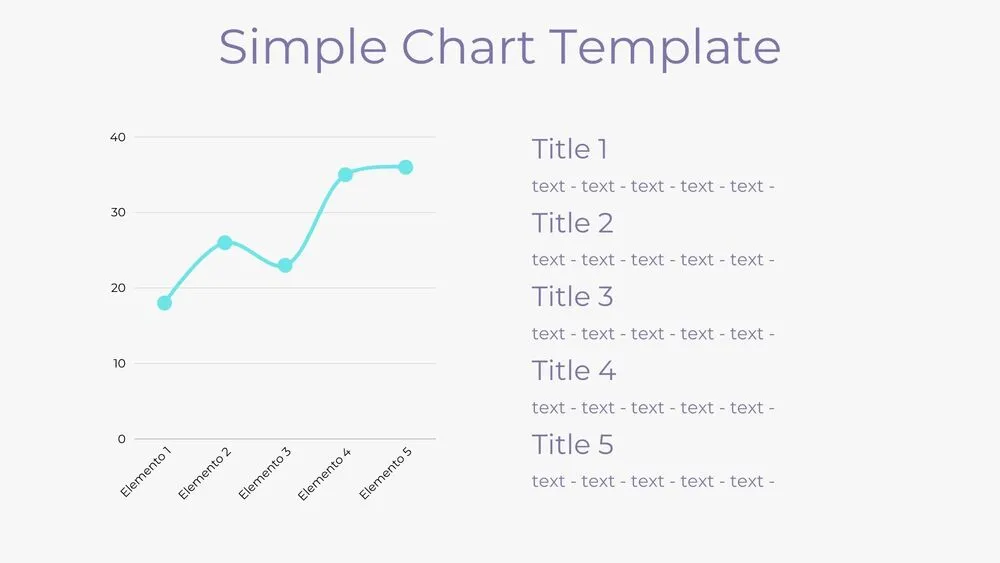
Line Chart Presentation Template for PowerPoint, Canva & Google Slides
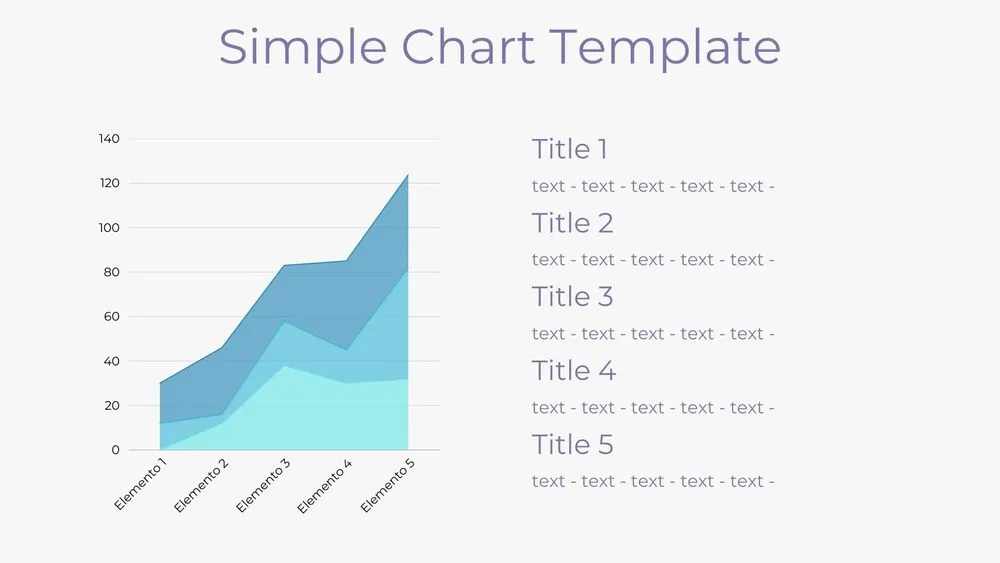
Area Chart Presentation Template for PowerPoint, Canva & Google Slides
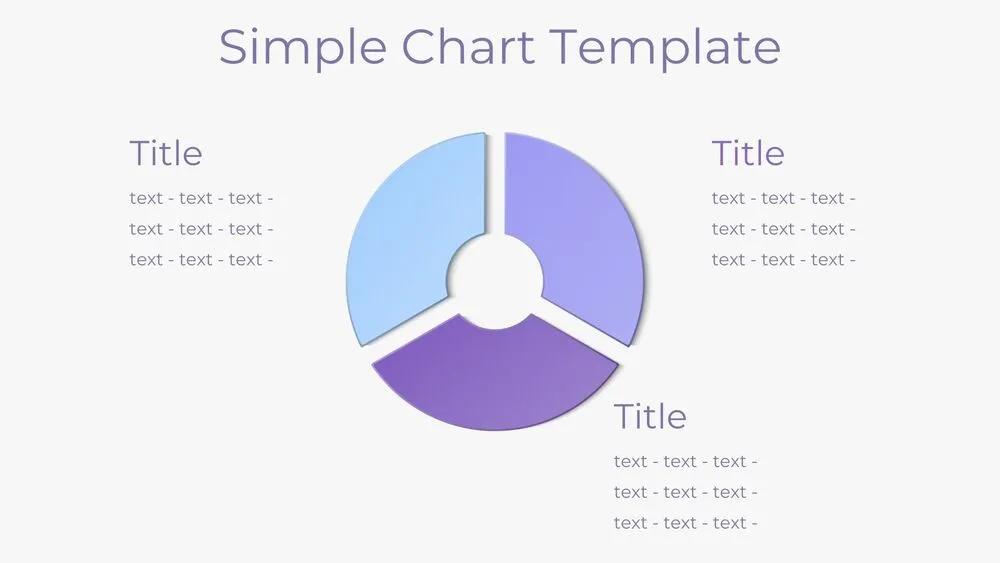
Donut Pie Chart Presentation Template for PowerPoint, Canva & Google Slides

Mobile App SWOT Analysis Presentation Template for PowerPoint, Canva & Google Slides

Coffee-Themed SWOT Analysis Presentation Template for PowerPoint, Canva & Google Slides