Fishbone Diagram Presentation Templates and Slides – Free & Premium for PowerPoint, Canva & Google Slides
Download free fishbone diagram presentation templates for PowerPoint, Canva, and Google Slides. Run root cause analysis fast with Ishikawa layouts, 6M categories, and action-ready slides ⬇️
Explore the Best Fishbone Diagram PowerPoint Templates, Google Slides & Canva Fishbone Diagram Themes
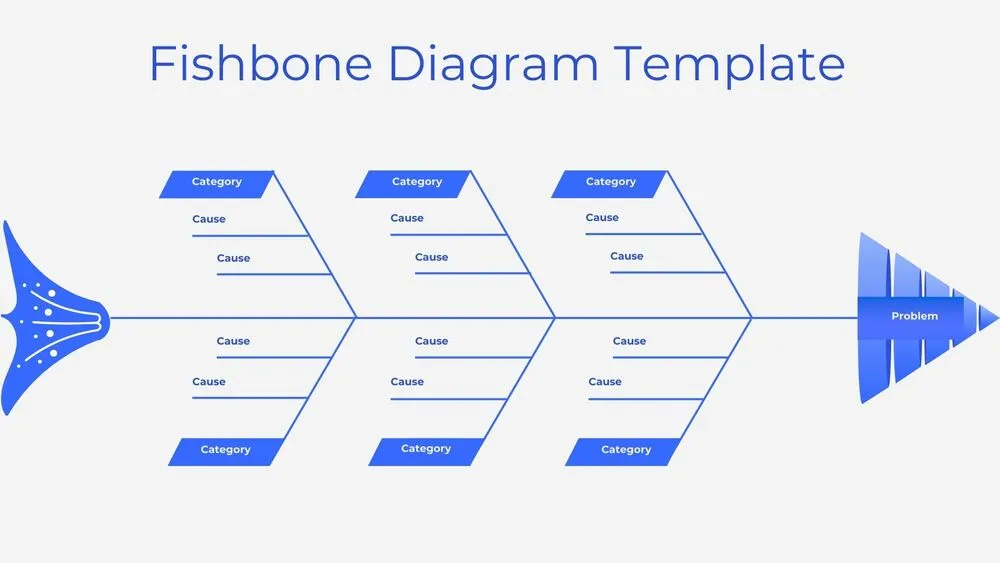
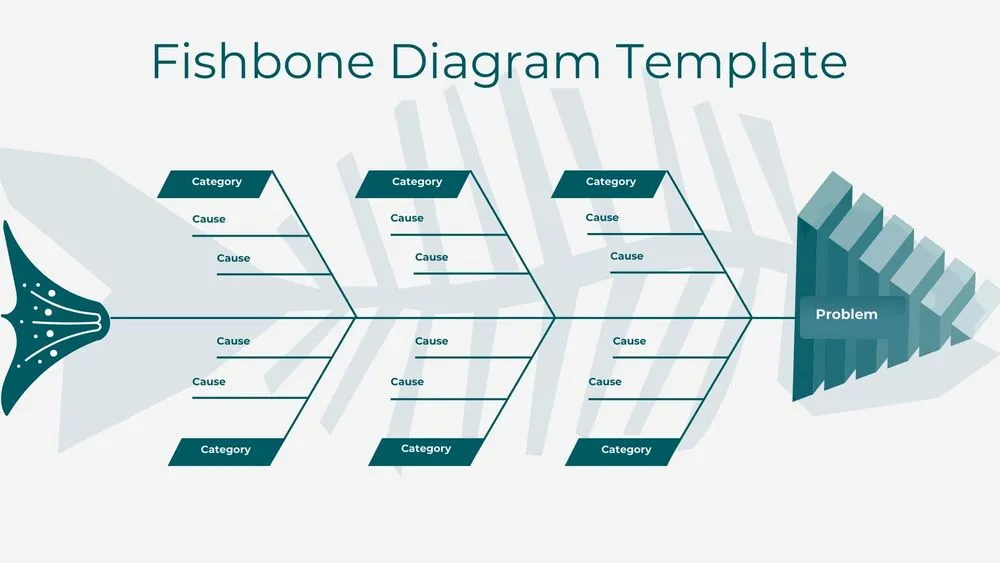
✨ Fishbone diagram slides help teams find root causes quickly by organizing ideas into clear cause-and-effect branches. Use these layouts to run focused RCA sessions and turn messy brainstorms into a structured map.
Best use cases include quality issues, delivery delays, customer complaints, and process defects. For example, map “late shipments” on the spine, then add causes under methods, materials, and manpower, and follow with 5 Whys prompts on the most likely branch.
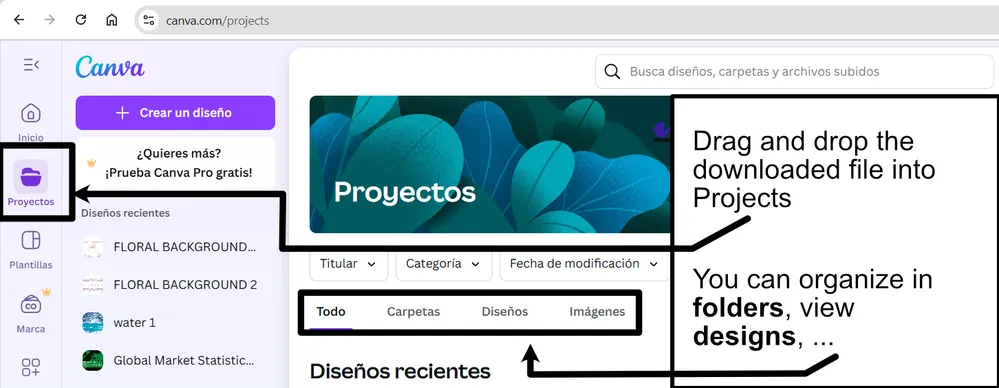
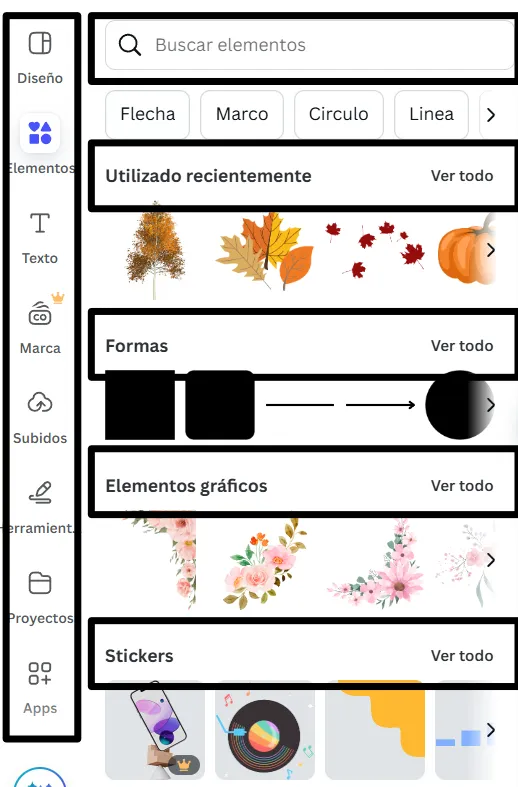
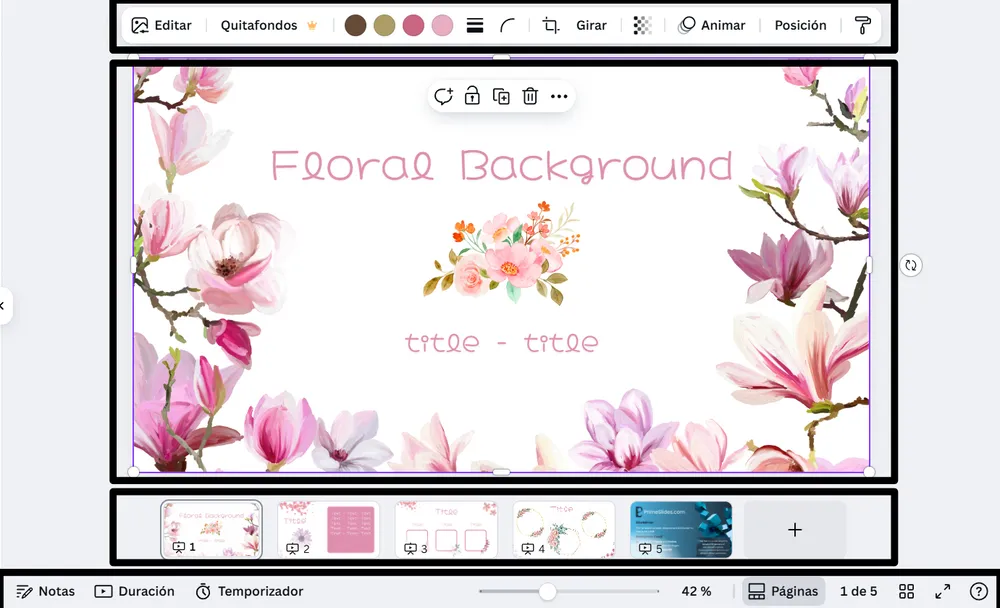
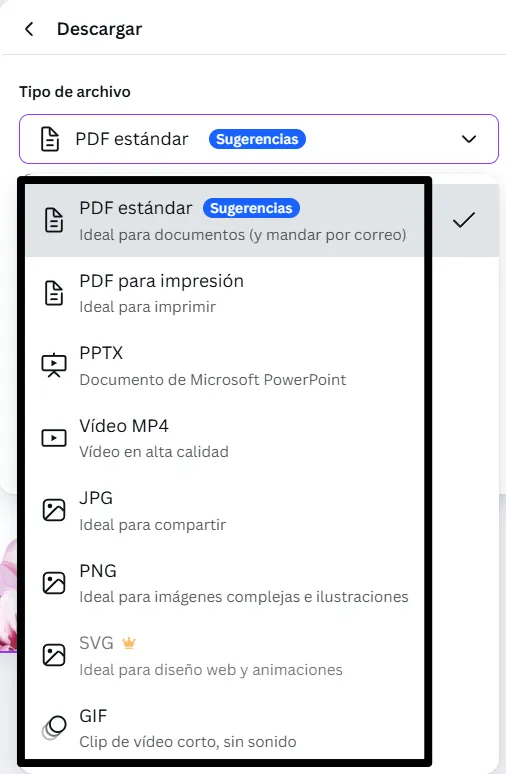
Edit everything in PowerPoint, Canva, or Google Slides, then present live in workshops and export a clean PDF for reports and follow-ups.
Readability tip: keep each label to a short phrase, limit each branch to the top causes, and move evidence and details to a notes or appendix slide.
Best for:
- Root cause analysis workshops
- Quality and process improvement
- Problem solving and troubleshooting
- Corrective action planning
- Operations and delivery reviews
Explore related templates:
❓ FAQs
Are these fishbone diagram presentation templates free to download?
Yes—this tag includes free fishbone diagram presentation templates. If a template is premium, it will be clearly labeled on its template page.
What is a fishbone (Ishikawa) diagram?
A cause-and-effect diagram that groups potential root causes into branches, helping teams investigate systematically and agree on fixes.
Do I need both a fishbone diagram and 5 Whys?
They work well together. Use the fishbone to capture causes broadly, then apply 5 Whys to the strongest branches to find the root cause.
Do these slides work in PowerPoint, Canva, and Google Slides?
Yes, you can edit and present them in PowerPoint, Canva, and Google Slides, then export to PDF for sharing.
Which categories should I use?
Start with 6M categories when it fits, or rename branches to match your process, like people, process, tools, data, and environment.
How do I keep the diagram readable and actionable?
Use short phrases, avoid overcrowding branches, and finish with an action plan slide that lists owners and due dates.