Growth Presentation Templates and Slides – Free & Premium for PowerPoint, Canva & Google Slides
Download free growth presentation templates for PowerPoint, Canva, and Google Slides. Present north star metrics, cohorts, funnels, and roadmaps that turn insights into clear next steps ⬇️
Explore the Best Growth PowerPoint Templates, Google Slides & Canva Growth Themes
✨ Growth slides help you show what’s working, what’s not, and what you’ll do next, all in a format leaders can scan quickly. Use them to connect metrics to decisions, not just report numbers.
Best use cases include weekly growth reviews, investor updates, and quarterly planning. For example, start with a north star metric and KPI tiles, then add a funnel slide for drop-offs and a cohort view for retention, followed by a short roadmap of the next experiments.
Edit everything in PowerPoint, Canva, or Google Slides, then present live and export a polished PDF for async updates.
Readability tip: keep one insight per slide, use consistent chart scales, and add a single takeaway sentence above every visual.
Best for:
- Weekly growth and KPI reviews
- Funnels and conversion reporting
- Cohort retention analysis
- Roadmaps, timelines, and milestones
- Executive summaries and investor updates
Explore related templates:
❓ FAQs
Are these growth presentation templates free to download?
Yes—this tag includes free growth presentation templates. If a template is premium, it will be clearly labeled on its template page.
What is a growth presentation template?
A slide deck designed to communicate growth, including KPIs, funnels, cohorts, experiments, and roadmaps you can edit quickly.
Which metrics should I include?
Lead with a north star metric, then show acquisition, activation, retention, revenue, CAC, and LTV with clear targets or benchmarks.
Do these slides work in PowerPoint, Canva, and Google Slides?
Yes, you can edit and present them in PowerPoint, Canva, and Google Slides, then export to PDF for sharing.
How do I show experiments and impact?
Use a simple card for hypothesis, change, and result, then summarize impact on one KPI. Add winners to a roadmap with owners and dates.
Any design tips for growth decks?
Keep visuals simple, use one accent color, and end with decisions and next steps so the meeting produces action.
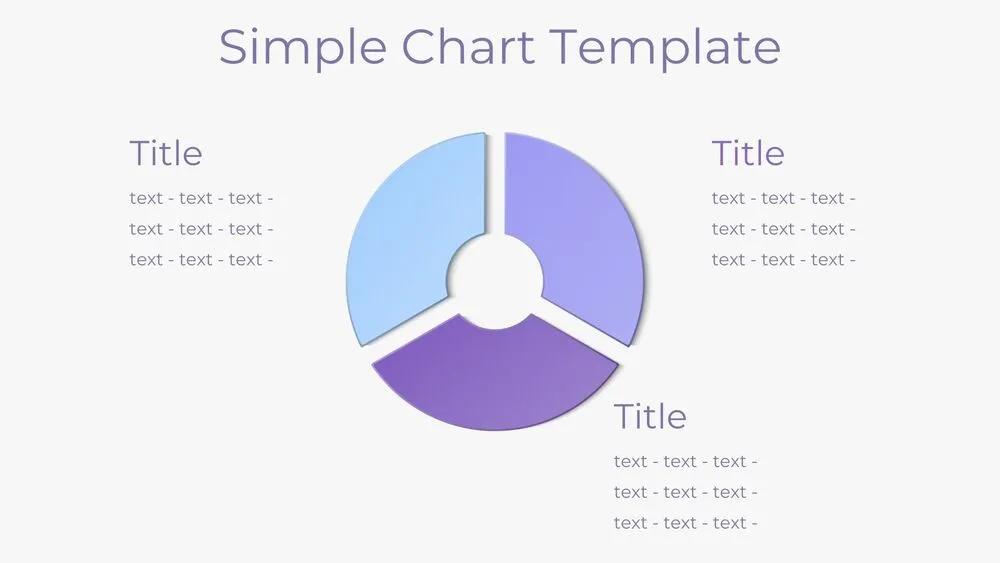
Donut Pie Chart Presentation Template for PowerPoint, Canva & Google Slides

Tech Startup Competitive Analysis Presentation Template for PowerPoint, Canva & Google Slides

E-commerce Fashion Competitive Analysis Presentation Template for PowerPoint, Canva & Google Slides
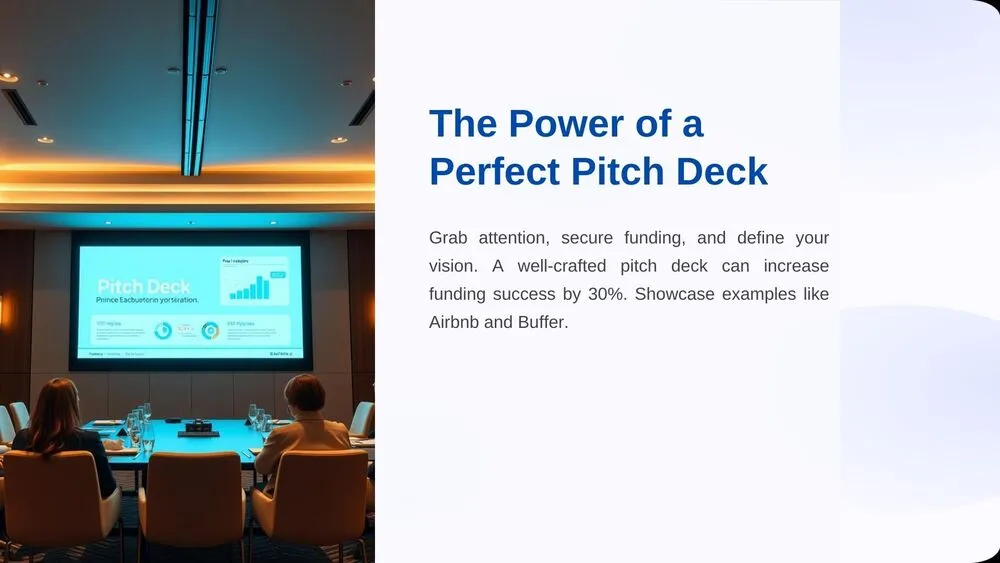
Professional Blue Pitch Deck Presentation Template for Business Strategy & Proposals