KPI Presentation Templates and Slides – Free & Premium for PowerPoint, Canva & Google Slides
Download free KPI presentation templates for PowerPoint, Canva, and Google Slides. Track goals with clean dashboards, scorecards, and charts that are ready to present ⬇️
Explore the Best KPI PowerPoint Templates, Google Slides & Canva KPI Themes
✨ KPI slides help you turn metrics into decisions, fast. Use these presentation layouts to summarize performance, highlight what changed, and make next steps clear for weekly check-ins, monthly reports, and executive updates.
They’re ideal for team scorecards, OKR progress reviews, sales and marketing dashboards, and operations reporting. For example, you can show target vs actual for revenue, pipeline, and conversion rate, then add a short action checklist with owners and due dates.
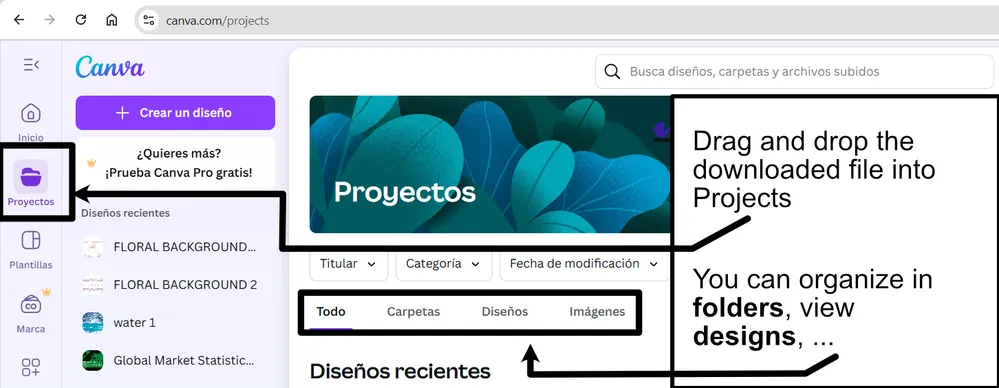
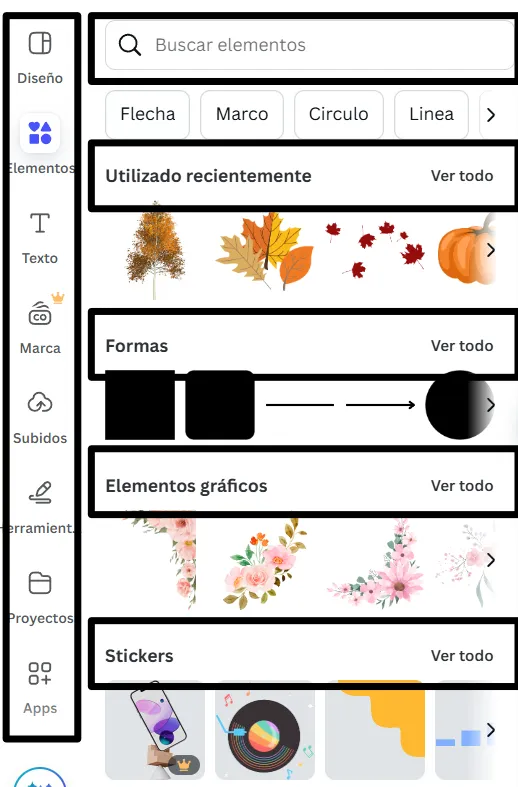
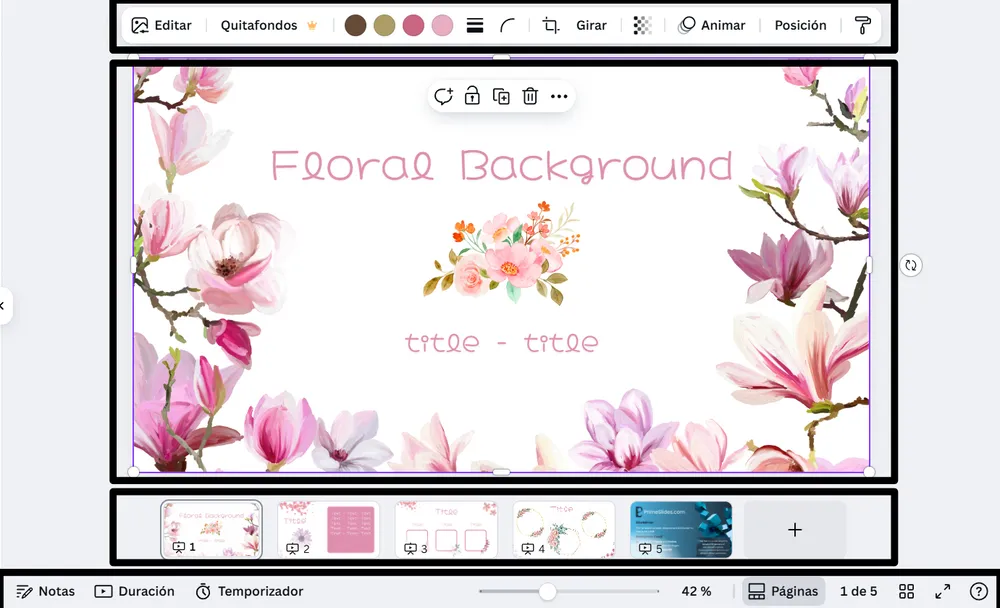
Edit everything in PowerPoint, Canva, and Google Slides, then present live or export to PDF for sharing with stakeholders. Update charts from Sheets or Excel, adjust thresholds, and keep status labels consistent across the deck.
Readability tip: lead with the outcome, then use one main chart per slide and keep supporting numbers secondary.
Best for:
- Monthly KPI reports and executive summaries
- OKR and goal tracking reviews
- Department dashboards for sales, marketing, and ops
- Target vs actual and variance breakdowns
- Action plans with owners and timelines
Explore related templates:
❓ FAQs
Are these KPI presentation templates free to download?
Yes—this tag includes free KPI presentation templates. If a template is premium, it will be clearly labeled on its template page.
What is a KPI presentation template?
A ready-to-edit deck with scorecards, charts, and tables for tracking key performance indicators and sharing results clearly.
How do I design a KPI dashboard slide?
Choose a small set of KPIs, show target vs actual, add a status label, and finish with one action block that explains what to do next.
Which visuals work best for KPIs?
Use line charts for trends, bars for comparisons, and simple tables for targets and deltas. Avoid clutter and keep labels consistent.
Do these slides work in PowerPoint, Canva, and Google Slides?
Yes, you can edit the slides in PowerPoint, Canva, and Google Slides, present live, and export to PDF for sharing.
How many KPIs should I include per slide?
Keep it to 3–6 KPIs per dashboard slide, and use separate slides when a metric needs context or a deeper breakdown.
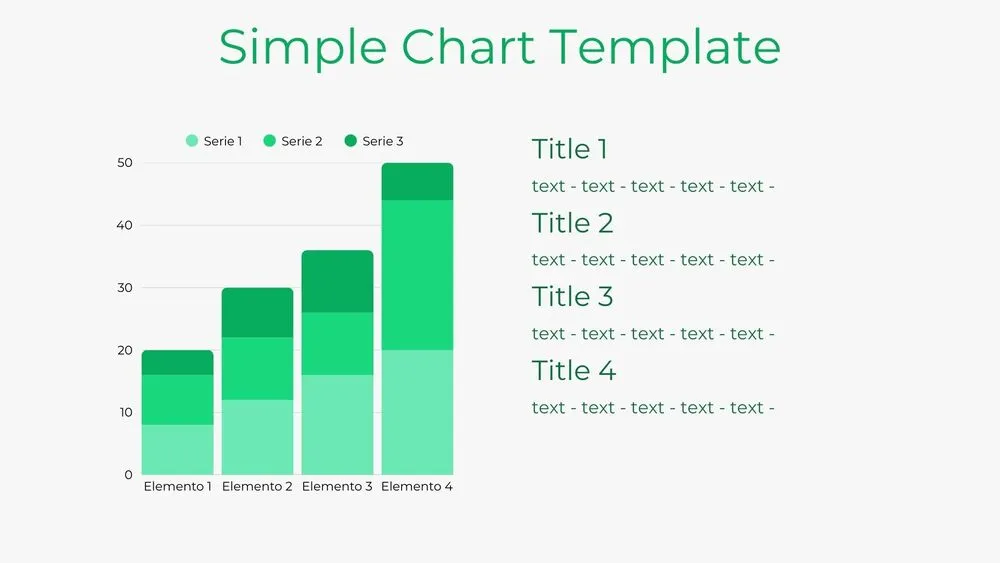
Bar Chart Presentation Template for PowerPoint, Canva & Google Slides
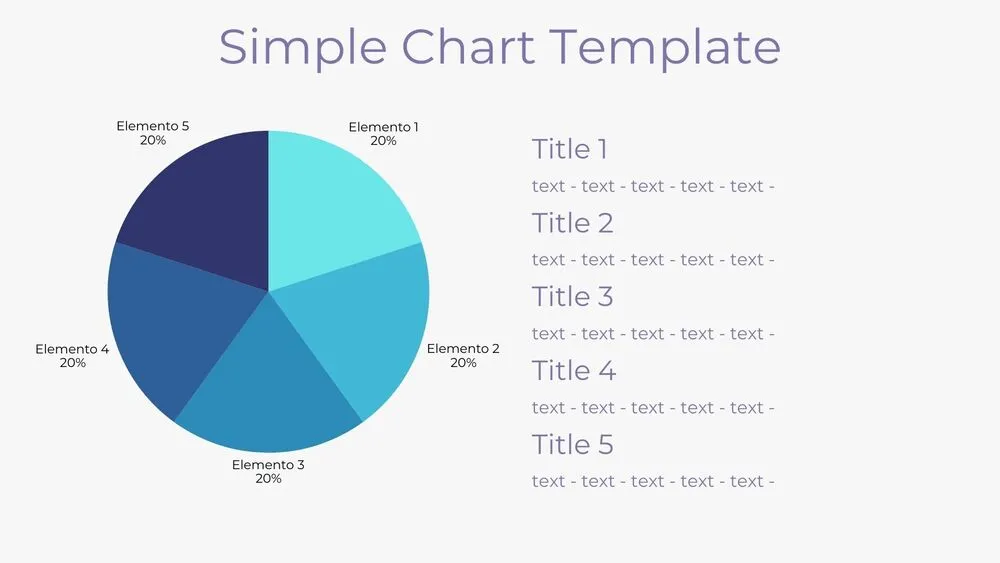
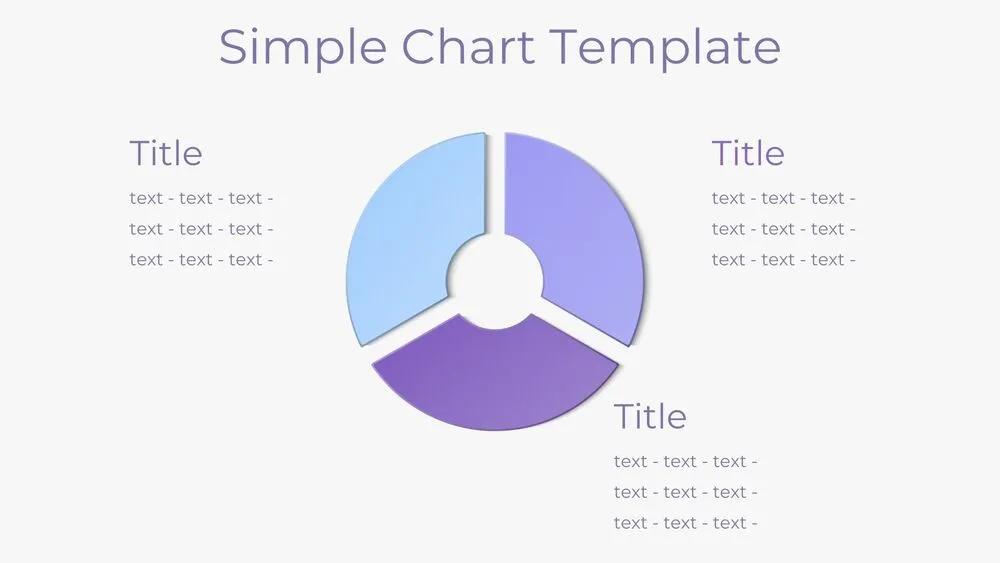
Solid Pie Chart Presentation Template for PowerPoint, Canva & Google Slides
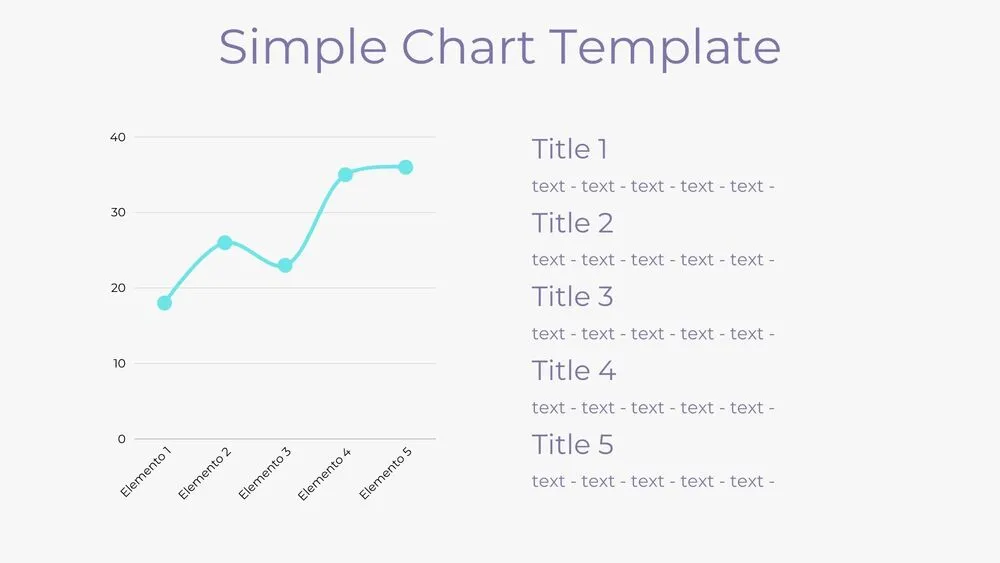
Line Chart Presentation Template for PowerPoint, Canva & Google Slides
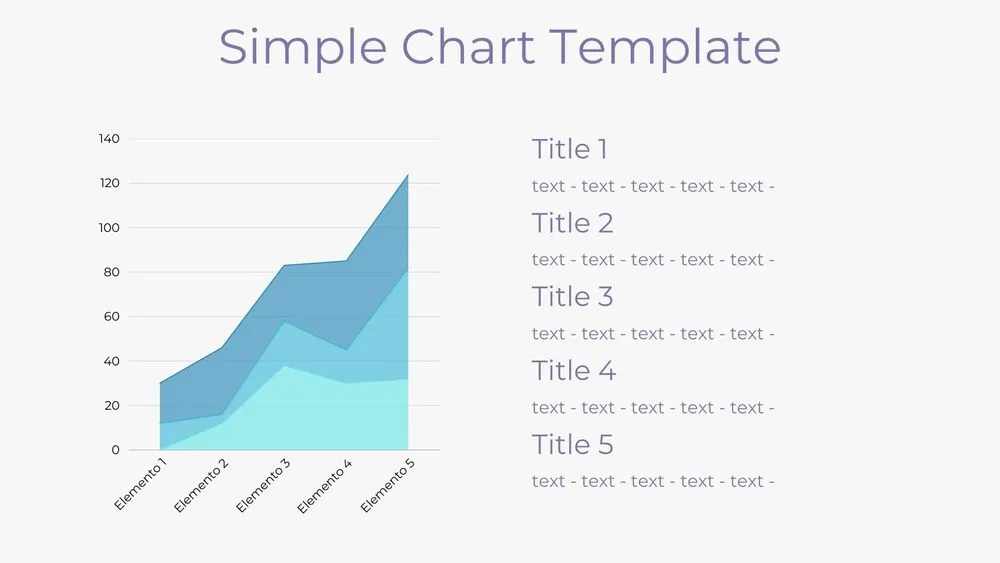
Area Chart Presentation Template for PowerPoint, Canva & Google Slides