Pie Chart Presentation Templates and Slides – Free & Premium for PowerPoint, Canva & Google Slides
Download free pie chart presentation templates for PowerPoint, Canva, and Google Slides. Show parts of a whole fast with clean slices, direct labels, and readable legends ⬇️
Explore the Best Pie Chart PowerPoint Templates, Google Slides & Canva Pie Chart Themes
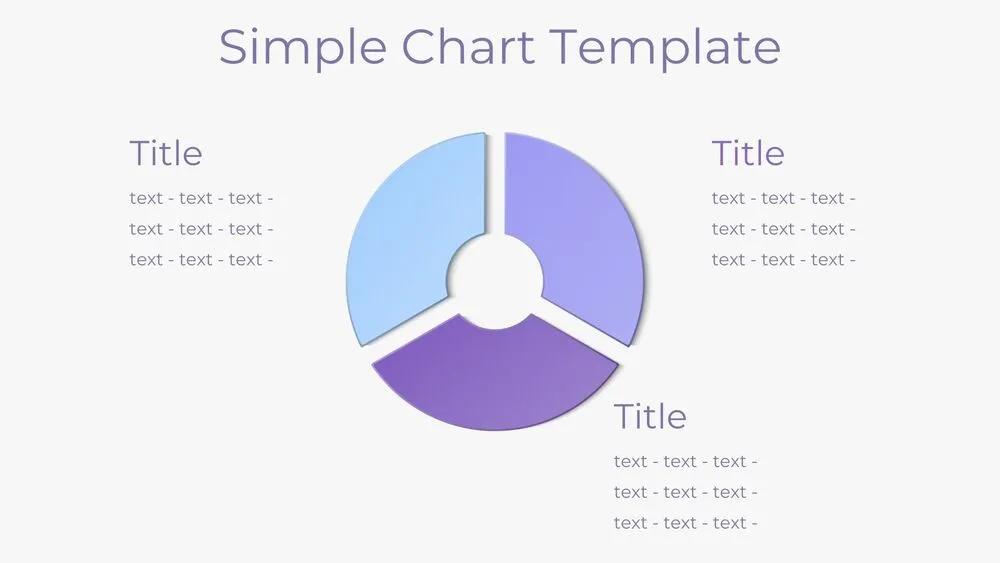
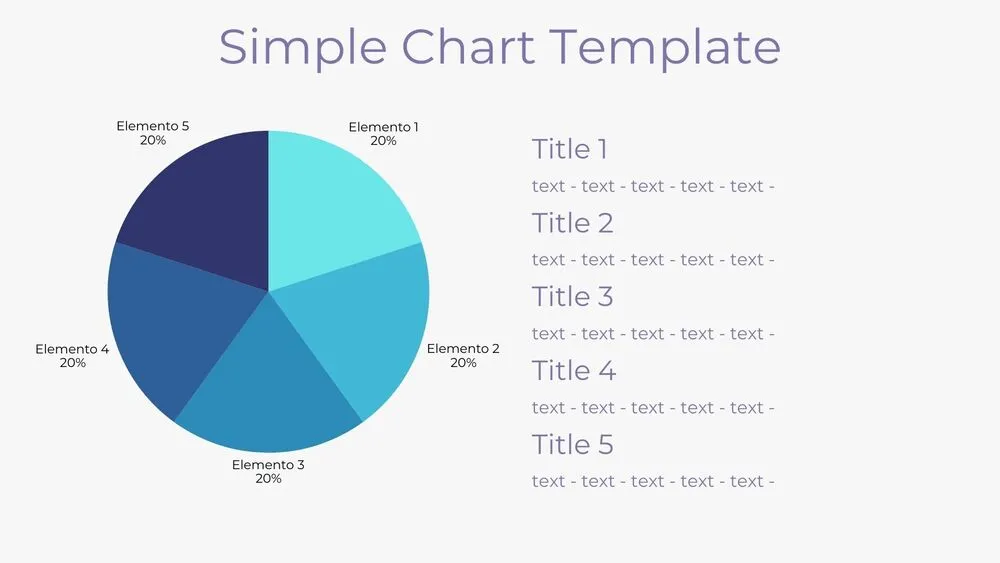
✨ Pie chart slides are best for showing parts of a whole in a way people understand instantly. Use these presentation layouts to visualize market share, budget allocation, survey splits, and category breakdowns with clean labels and minimal clutter.
They work well in reports, strategy decks, and classroom explainers where you want a quick summary. For example, show how a budget is split across channels, highlight the top slice with a short callout, and group tiny categories into “other” so the chart stays readable.
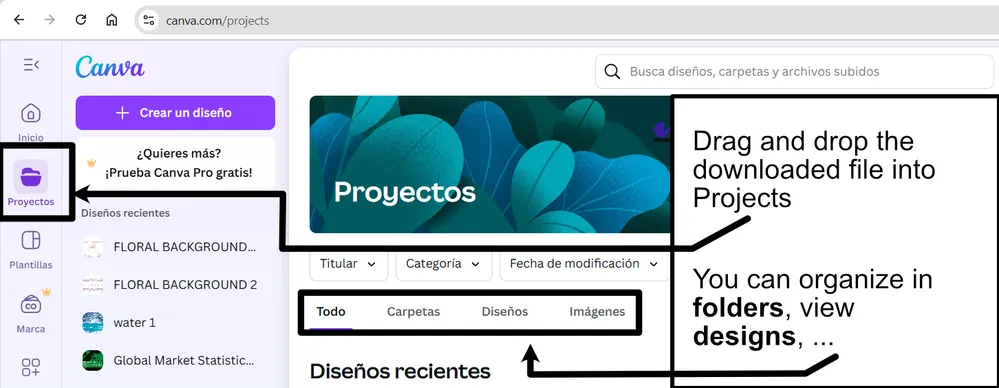
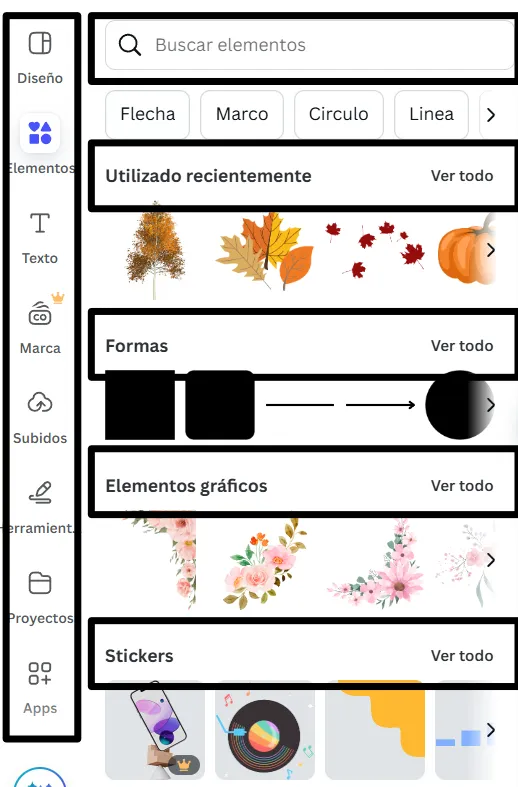
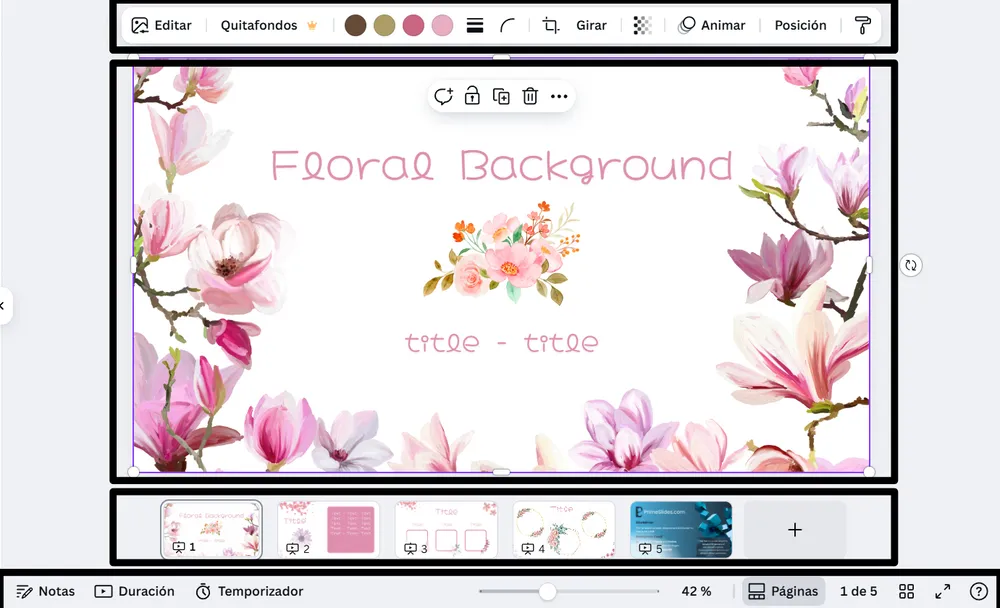
Edit the charts in PowerPoint, Canva, and Google Slides, then present live or export to PDF for sharing. Paste data from Sheets or Excel, keep slice order consistent across slides, and pair the pie with a small table when exact values matter.
Readability tip: keep pies to 5–6 slices max and use direct labels with percentages instead of long legends.
Best for:
- Market share and category breakdowns
- Budget allocation and spend splits
- Survey results and response distributions
- Portfolio mix and segment reporting
- Quick executive summaries
Explore related templates:
❓ FAQs
Are these pie chart presentation templates free to download?
Yes—this tag includes free pie chart presentation templates. If a template is premium, it will be clearly labeled on its template page.
When should I use a pie chart?
Use a pie chart when you have a small number of categories and want to show a clear parts-of-a-whole split at a glance.
Pie vs donut, what’s better?
Donuts give you space for a total or headline in the center, while pies can be simpler to read. Choose the version that keeps labels clear.
How do I label slices clearly?
Use direct labels with percentages, group small categories into “other,” and avoid 3D effects that distort the slice sizes.
Do these slides work in PowerPoint, Canva, and Google Slides?
Yes, you can edit the slides in PowerPoint, Canva, and Google Slides, present live, and export to PDF for sharing.
Can I combine pies with other visuals?
Yes, pair a pie with a table for exact numbers or a bar chart for ranking, and add a short takeaway to make the insight obvious.