Venn Diagram Presentation Templates and Slides – Free & Premium for PowerPoint, Canva & Google Slides
Download free venn diagram presentation templates for PowerPoint, Canva, and Google Slides. Compare and contrast ideas with clean, editable 2–3 circle diagrams for class and work ⬇️
Explore the best venn diagram presentation templates and slides for PowerPoint, Canva & Google Slides
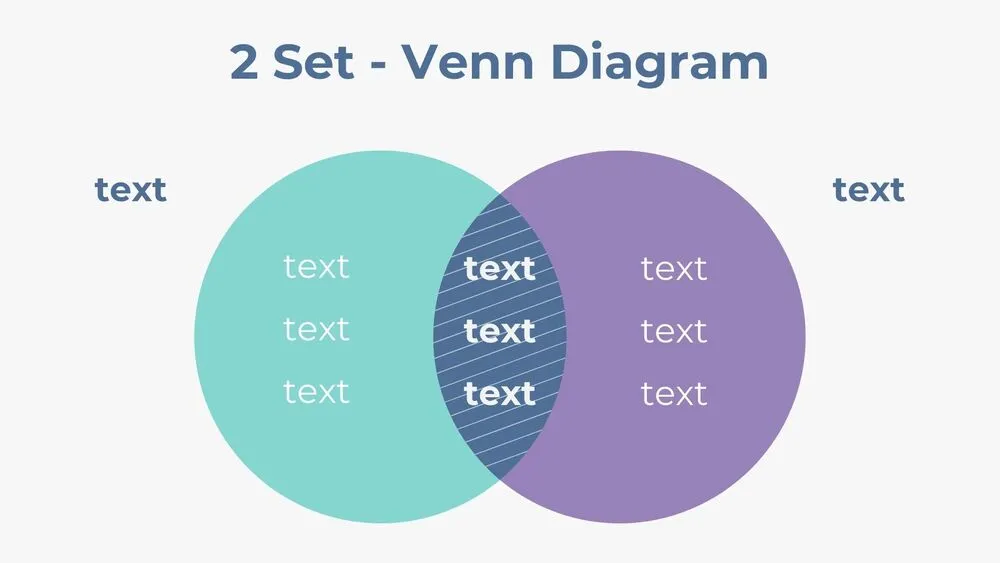
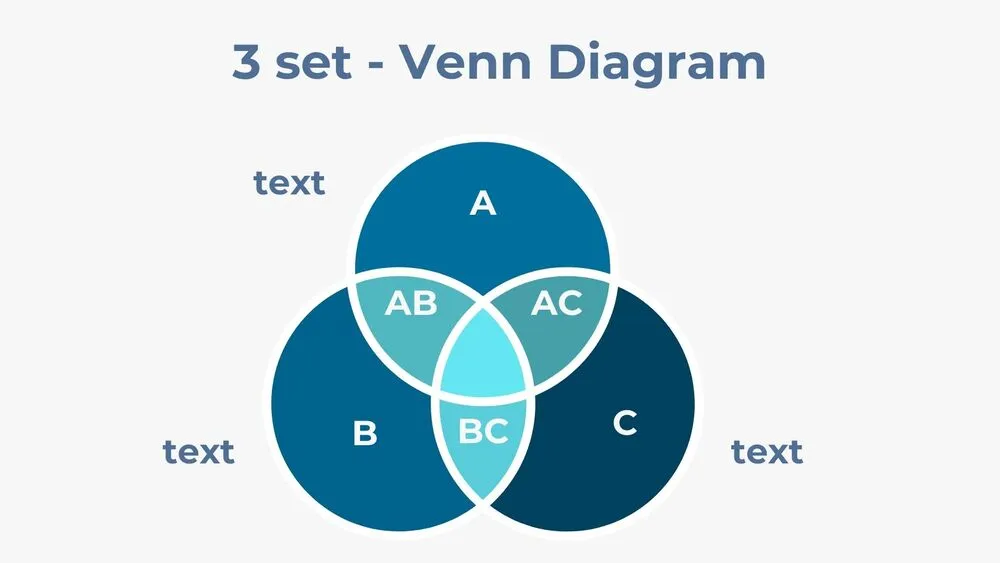
✨ Venn diagram presentation templates help you compare and contrast topics with clear overlapping circles and labeled intersections. They’re perfect for showing what’s unique, what’s shared, and how concepts connect in one easy-to-read visual.
Best use cases include compare and contrast essays, lesson discussions, product comparisons, and decision workshops. For example, compare two historical periods, two scientific methods, or two product plans, then use the overlap to list shared features or shared outcomes.
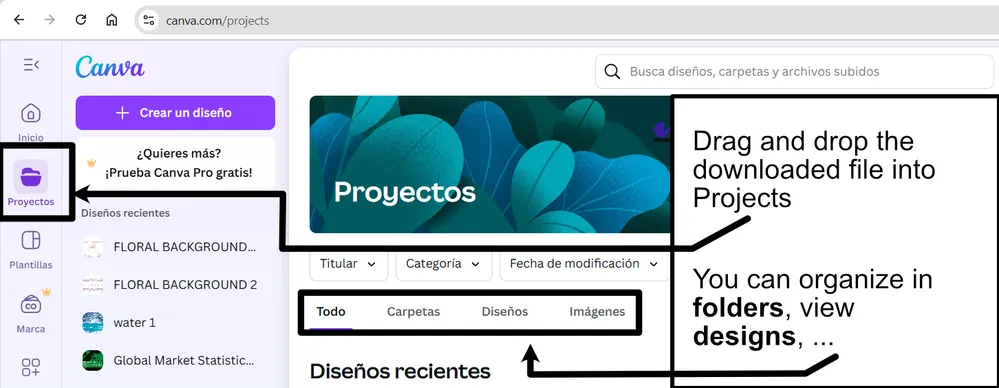
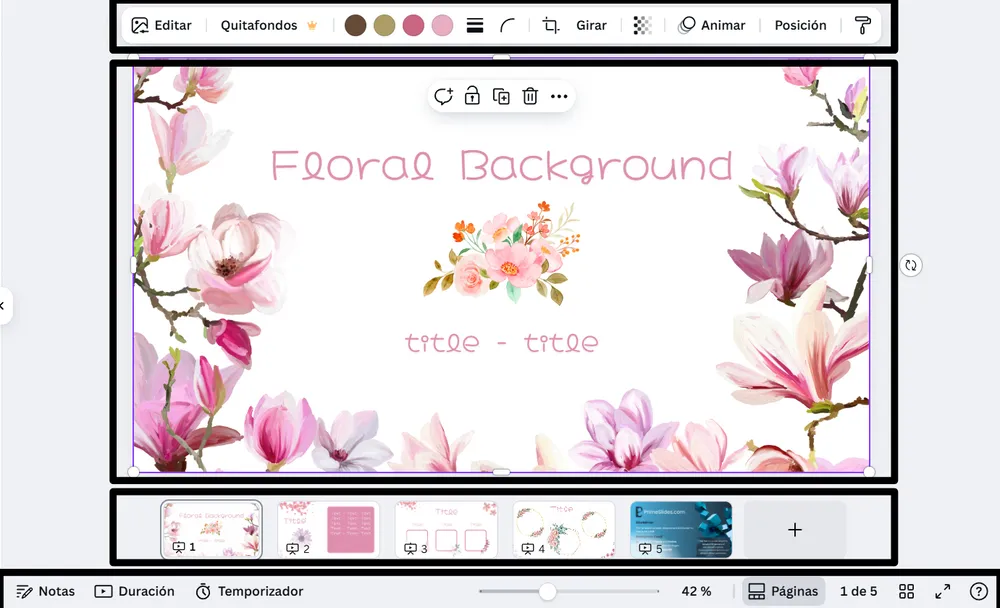
Edit in PowerPoint, Canva, or Google Slides, then present live or export to PDF for handouts. If you need fast collaboration, start with a venn diagram google slides template, keep colors limited to 2–4, and use short labels so the intersections stay readable.
Readability tip: Keep each circle to 3–5 short points, and move extra details to a follow-up slide to avoid clutter.
Best for:
- Compare and contrast lesson slides
- Classroom discussions and worksheets
- Product and feature comparisons
- Decision-making and analysis workshops
- Simple visuals for quick explanations
Explore related templates:
❓ FAQs
Are these venn diagram presentation templates free to download?
Yes—this tag includes free venn diagram presentation templates. If a template is premium, it will be clearly labeled on its template page.
What is a venn diagram template?
An editable slide layout with overlapping circles to compare items, showing differences and shared points in the intersections.
Do these slides work in PowerPoint, Canva, and Google Slides?
Yes, you can edit and present them in PowerPoint, Canva, and Google Slides, then export to PDF for sharing.
How do I make a venn diagram in Google Slides?
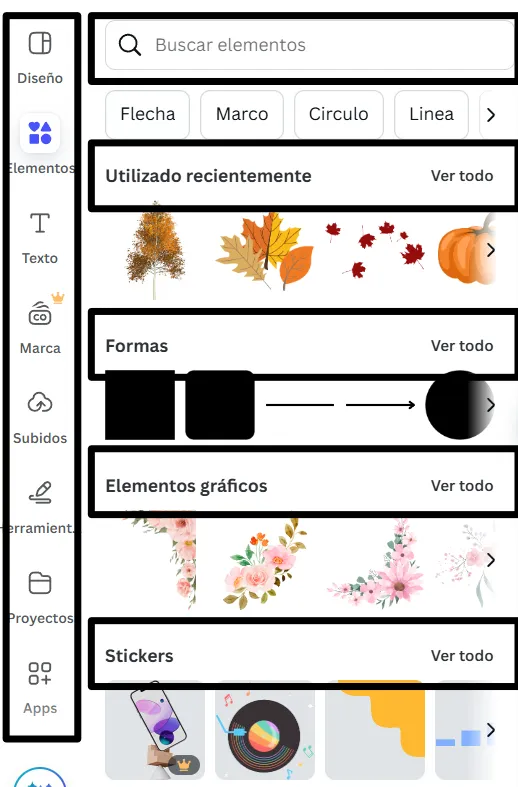
Insert circles, duplicate them, set some transparency, then add labels, or start from a venn diagram google slides template to save time.
How many circles should I use?
Use 2 circles for the clearest comparisons, 3 for more depth, and 4 only when you can keep labels very short.
How do I keep a venn diagram readable?
Limit colors, keep points short, and avoid filling every intersection, if it gets crowded, split the comparison into two slides.