Donut Pie Chart Presentation Template for PowerPoint, Canva & Google Slides
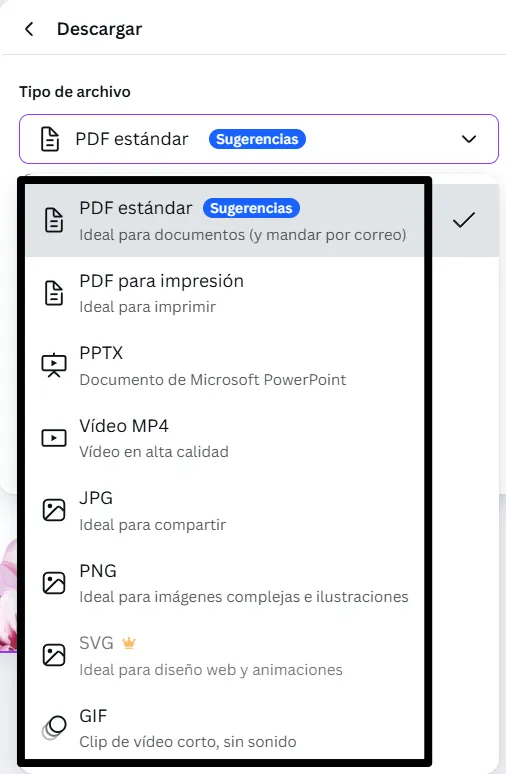
Download the template for PowerPoint, Google Slides or Canva with just one click
Editable Pie Chart Templates and Slides for Business & Education
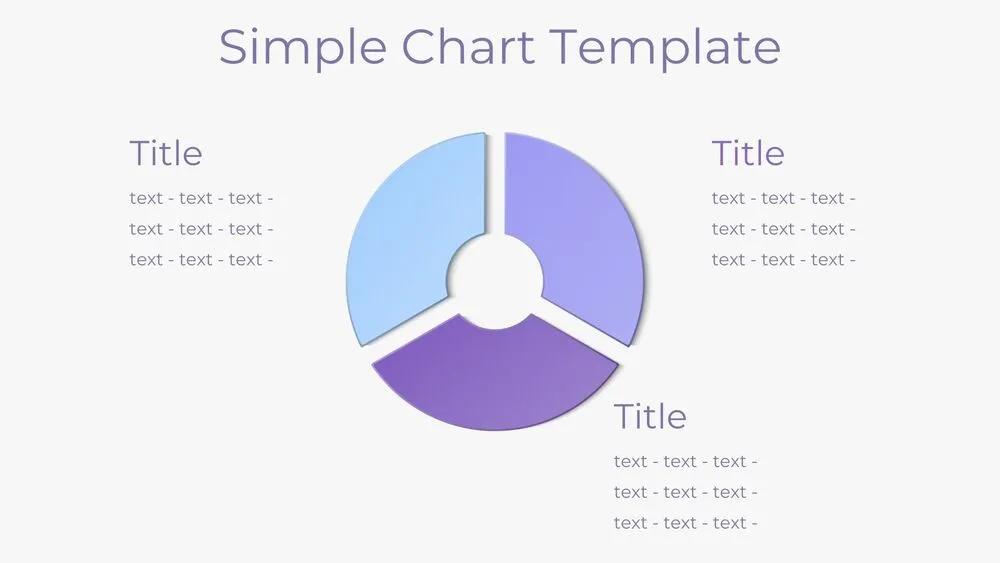
This donut-style pie chart template features separated segments that highlight each data category with clarity and balance. It includes 3-, 4-, and 5-part variations in soft purple and blue gradients, making it adaptable for different purposes. Ideal for visualizing KPIs, budget allocations, or market share, the design combines simplicity with professionalism. Whether used in classrooms, corporate dashboards, or project proposals, it ensures data is presented in a way that is both engaging and easy to understand.
- 3 layouts: 3 / 4 / 5 separated slices (donut style)
- Purple + white aesthetic for clean visibility
- Side title + text blocks per slice for quick explanations
- Great for KPI, budget, performance and market analysis
- Fully editable in PowerPoint, Canva & Google Slides
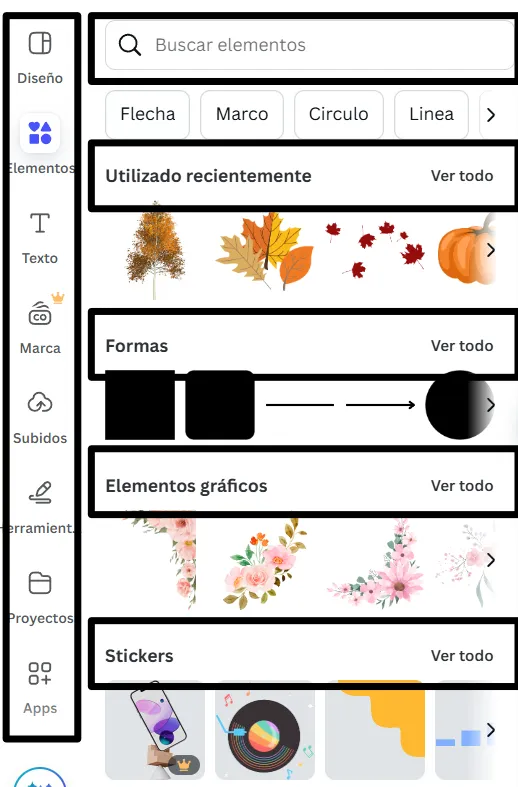
Edit fonts, colors, and images effortlessly using Canva’s drag-and-drop editor. Access free elements, illustrations, and fonts to personalize each slide your way.
📌 Frequently Asked Questions
Click on the Google Slides button, then select “Make a copy” when prompted. This will create a copy of the template in your Google Drive, ready to edit and use in Google Slides.
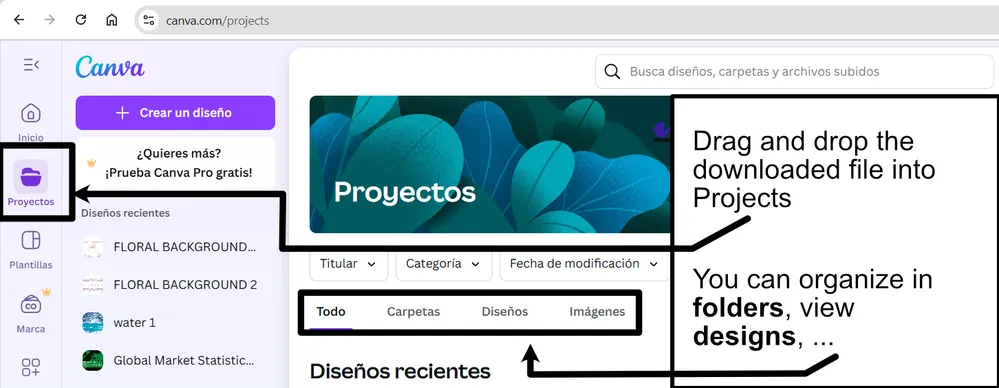
Simply download the file, then open Canva and drag the downloaded file into your desired folder. Once uploaded, it’s ready to be edited just like any other Canva project.